Loading...
Loading...
Loading...
Loading...
Loading...
Loading...
Loading...
Loading...
Loading...
Loading...
Loading...
Loading...
Loading...
Loading...
Loading...
Loading...
Loading...
Loading...
Loading...
Loading...
Loading...
Loading...
Loading...
Loading...
Loading...
Loading...
Loading...
Loading...
Loading...
Loading...
Loading...
Loading...
Loading...
Loading...
Loading...
Loading...
Loading...
Loading...
Loading...
Loading...
Loading...
Loading...
Loading...
Loading...
Loading...
Loading...
Loading...
Loading...
Loading...
Loading...
Loading...
Loading...
Loading...
Loading...
Loading...
Loading...
Loading...
In progress
This guide provides a step-by-step guide to monitoring and operating the DIGIT Platform and services in production.
Role-based access control
Role-based access control (RBAC) regulates access to a computer or network resources based on the roles of individual users within your organization.
RBAC authorization uses the rbac.authorization.k8s.io API group to drive authorization decisions, allowing you to configure policies through the Kubernetes API dynamically.
The RBAC API declares four Kubernetes objects: Role, ClusterRole, RoleBinding and ClusterRoleBinding. You can describe objects, or amend them, using tools such as kubectl, just like any other Kubernetes object.
Caution: These objects, by design, impose access restrictions. If you are making changes to a cluster as you learn, see privilege escalation prevention and bootstrapping to understand how those restrictions can prevent you from making some changes.
An RBAC Role or ClusterRole contains rules that represent a set of permissions. Permissions are purely additive (there are no "deny" rules).
A Role always sets permissions within a particular namespace; when you create a Role, you have to specify the namespace it belongs in.
ClusterRole, by contrast, is a non-namespaced resource. The resources have different names (Role and ClusterRole) because a Kubernetes object always has to be either namespaced or not namespaced; it can't be both.
ClusterRoles have several uses. You can use a ClusterRole to:
define permissions on namespaced resources and be granted access within individual namespace(s)
define permissions on namespaced resources and be granted access across all namespaces
define permissions on cluster-scoped resources
If you want to define a role within a namespace, use a Role; if you want to define a role cluster-wide, use a ClusterRole.
A ClusterRole can be used to grant the same permissions as a Role. Because ClusterRoles are cluster-scoped, you can also use them to grant access to:
cluster-scoped resources (like nodes)
non-resource endpoints (like /healthz)
namespaced resources (like Pods), across all namespaces
For example: you can use a ClusterRole to allow a particular user to run kubectl get pods --all-namespaces
Here is the Digit ClusterRole that can be used to grant read access and restricted admin access
A role binding grants the permissions defined in a role to a user or set of users. It holds a list of subjects (users, groups, or service accounts), and a reference to the role being granted. A RoleBinding grants permissions within a specific namespace whereas a ClusterRoleBinding grants that access cluster-wide.
A RoleBinding may reference any Role in the same namespace. Alternatively, a RoleBinding can reference a ClusterRole and bind that ClusterRole to the namespace of the RoleBinding. If you want to bind a ClusterRole to all the namespaces in your cluster, you use a ClusterRoleBinding.
Here is the Digit rolebinading that we are using to grant access to group
A RoleBinding can also reference a ClusterRole to grant the permissions defined in that ClusterRole to resources inside the RoleBinding's namespace. This kind of reference lets you define a set of common roles across your cluster, and then reuse them within multiple namespaces.
For instance, even though the following RoleBinding refers to a ClusterRole, "dave" (the subject, case sensitive) will only be able to read Secrets in the "development" namespace, because the RoleBinding's namespace (in its metadata) is "development".
You must add a namespace to a role section to grant access to a group of a namespace.
Git can be installed in any operating systems like Windows, Linux and Mac. Most of the Mac and Linux machines, Git will be pre-installed.
GitHub is an open source tool which helps the developers to manage, store, track and control changes in their code. If we want to clone(copy) the data from GItHub we need to install Git.
There are some alternatives for GitHub like GitLab, Bitbucket. But many developers prefer GitHub because it's more popular and they are used to the navigation. So we are using Git in DIGIT
GitHub is used to create Individual projects.
To check whether Git is already installed in your systems, open in terminal.
If you are in Mac, look for the command prompt application called "Terminal".
If you are in Windows, open the windows command prompt or "Git Bash".
Type the below command:
In Ubuntu using terminal we can directly install Git using terminal.
Go to command prompt shell and run the following command to make sure everything is up-to-date.
After that run the following command to install Git.
Once the command output has completed, verify the installation using
Go to the following page to download the Git latest version: For Windows: https://gitforwindows.org/ For Mac: https://sourceforge.net/projects/git-osx-installer/files/git-2.23.0-intel-universal-mavericks.dmg/download?use_mirror=autoselect
Once the installation is done, open the windows command prompt or Git Bash and type
This tutorial will walk you through How to take DB dump
On this page, you will find the steps on how to create a database dump.
To create a database dump, execute the dump command (given below) in the playground pod.
kubectl get pods -n playground
kubectl exec <playground-pod-name> -it -n playground bash
Use the below command to take a backup.
pg_dump -Fp --no-acl --no-owner --no-privileges -h <db-host> egov_db -U dbusername > backup.sql
gzip backup.sql.gz backup.sql
Copy the zip file to your local machine using the below command.
kubectl cp <playground-pod-name>:/backup.sql.gz backup.sql.gz -n playground
A fork is a copy of a repository that you manage. Forks let you make changes to a project without affecting the original repository.
You can fetch updates from or submit changes to the original repository with pull requests
A fork often occurs when a developer becomes dissatisfied or disillusioned with the direction of a project and wants to detach their work from that of the original project.
Creating a GitHub account and an organization to provide access and permissions to a repository.
An organization are shared accounts where businesses and open source projects can collaborate across many projects at once.There are three types accounts in GitHub
Personal accounts
Organization accounts
Enterprise accounts
Here the main reason for creating organization account is, accounts can be shared among unlimited number of people and they can collaborate across many projects at once.
Our organization name is eGovernments Foundation.
Go to https://github.com/
After completing the process Your GitHub account will be created.
Click on Sign Up. Create your account by using email and password. Then add Username.
After completing the process Your GitHub account will be created.
After setting up the GitHub account, we have to create an organization. Here we can add the data or code in the form of repository. Creating a repository, we will see this topic next.
Open Github and click on the "+" icon add top tight corner. You will see the option"new organization". click it.
click on "create a free organization"and enter your organization name you want to create with email and then '"next"
After Organization got created, you can see your organizations by clicking on "Accounts
Kubectl is a command line tool that you use to communicate with the Kubernetes API server.
Kubernetes also known as K8s, is an open-source system for automating deployment, scaling, and management of containerized applications.kubectl, allows you to run commands against Kubernetes clusters.
If you want to study about kubernetes in detail, open Kubernetes
There are some other tools like kubelet along with kubectl. kubectl is the command-line interface (CLI) tool for working with a Kubernetes cluster. Kubelet is the technology that applies, creates, updates, and destroys containers on a Kubernetes node.But the only difference is, using kubectl the developer can interacts with kubernetes cluster. So we are using kubectl in DIGIT.
Note: If you are using AWS as service to create cluster, You must use a kubectl version that is within one minor version difference of your Amazon EKS cluster control plane. For example, a 1.23 kubectl client works with Kubernetes 1.22, 1.23, and 1.24 clusters
Download the kubectl latest release v1.25.0. or if you have curl installed use this command:
If you want to download kubectl desired version just replace the version in above command with your version name
To download curl follow the page and proceed the download with curl https://www.wikihow.com/Install-Curl-on-Windows
Append or prepend the kubectl binary folder to your PATH environment variable. To perform this, complete the following steps:
Once you install kubectl, you can verify its version with the following command:
Open the below link to install kubectl in linux: https://kubernetes.io/docs/tasks/tools/install-kubectl-linux/
Open the below link to install kubectl in macos: https://kubernetes.io/docs/tasks/tools/install-kubectl-macos/
Operational Guidelines & Security Standards
The objective is to provide a clear guide for efficiently using DIGIT infrastructure on various platforms like SDC, NIC, or commercial clouds. This document outlines the infrastructure overview, operational guidelines, and recommendations, along with the segregation of duties (SoD). It helps to plan the procurement and build the necessary capabilities to deploy and implement DIGIT.
In a shared control scenario, the state program team must adhere to these guidelines and develop their own control implementation for the state's cloud infrastructure and collaborations with partners. This ensures standardized and smooth operational excellence in the overall system.
DIGIT Platform is designed as a microservices architecture, using open-source technologies and containerized apps and services. DIGIT components/services are deployed as docker containers on a platform called Kubernetes, which provides flexibility for running cloud-native applications anywhere like physical or virtual infrastructure or hypervisor or HCI and so on. Kubernetes handles the work of scheduling containerized services onto a compute cluster and manages the workloads to ensure they run as intended. And it substantially simplifies the deployment and management of microservices.
Provisioning the Kubernetes cluster will vary across from commercial clouds to state data centres, especially in the absence of managed Kubernetes services like AWS, Azure, GCP and NIC. Kubernetes clusters can also be provisioned on state data centres with bare-metal, virtual machines, hypervisors, HCI, etc. However providing integrated networking, monitoring, logging, and alerting is critical for operating Kubernetes Clusters when it comes to State data centers. DIGIT Platform also offers add-ons to monitor Kubernetes cluster performance, logging, tracing, service monitoring and alerting, which the implementation team can take advantage.
Below are the useful links to understand Kubernetes:
DIGIT Deployment on Kubernetes
User Accounts/VPN
Dev, UAT and Prod Envs
3
User Roles
Admin, Deploy, ReadOnly
3
OS
Any Linux (preferably Ubuntu/RHEL)
All
Kubernetes as a managed service or VMs to provision Kubernetes
Managed Kubernetes service with HA/DRS
(Or) VMs with 2 vCore, 4 GB RAM, 20 GB Disk
If no managed k8s
3 VMs/env
Dev - 3 VMs
UAT - 3VMs
Prod - 3VMs
Kubernetes worker nodes or VMs to provision Kube worker nodes.
VMs with 4 vCore, 16 GB RAM, 20 GB Disk / per env
3-5 VMs/env
DEV - 3VMs
UAT - 4VMs
PROD - 5VMs
Disk Storage (NFS/iSCSI)
Storage with backup, snapshot, dynamic inc/dec
1 TB/env
Dev - 1000 GB
UAT - 800 GB
PROD - 1.5 TB
VM Instance IOPS
Max throughput 1750 MB/s
1750 MS/s
Disk IOPS
Max throughput 1000 MB/s
1000 MB/s
Internet Speed
Min 100 MB - 1000MB/Sec (dedicated bandwidth)
Public IP/NAT or LB
Internet-facing 1 public ip per env
3
3 Ips
Availability Region
VMs from the different region is preferable for the DRS/HA
at least 2 Regions
Private vLan
Per env all VMs should within private vLan
3
Gateways
NAT Gateway, Internet Gateway, Payment and SMS gateway
1 per env
Firewall
Ability to configure Inbound, Outbound ports/rules
Managed DataBase
(or) VM Instance
Postgres 12 above Managed DB with backup, snapshot, logging.
(Or) 1 VM with 4 vCore, 16 GB RAM, 100 GB Disk per env.
per env
DEV - 1VMs
UAT - 1VMs
PROD - 2VMs
CI/CD server self hosted (or) Managed DevOps
Self Hosted Jenkins : Master, Slave (VM 4vCore, 8 GB each)
(Or) Managed CI/CD: NIC DevOps or AWS CodeDeploy or Azure DevOps
2 VMs (Master, Slave)
Nexus Repo
Self hosted Artifactory Repo (Or) NIC Nexus Artifactory
1
DockerRegistry
DockerHub (Or) SelfHosted private docker reg
1
Git/SCM
GitHub (Or) Any Source Control tool
1
DNS
main domain & ability to add more sub-domain
1
SSL Certificate
NIC managed (Or) SDC managed SSL certificate per URL
2 urls per env
DIGIT strongly recommends Site reliability engineering (SRE) principles as a key means to bridge development and operations gaps by applying a software engineering mindset to system and IT administration topics. In general, an SRE team is responsible for the availability, latency, performance, efficiency, change management, monitoring, emergency response, and capacity planning.
Commercial clouds like AWS, Azure and GCP offer sophisticated monitoring solutions across various infra levels like CloudWatch and StackDriver. In the absence of such managed services to monitor, we can look at various best practices and tools listed below which help in debugging and troubleshooting efficiently.
Segregation of duties and responsibilities.
SME and SPOCs for L1.5 support along with the SLAs defined.
Ticketing system to manage incidents, converge and collaborate on various operational issues.
Monitoring dashboards at various levels like Infrastructure, networks and applications.
Transparency of monitoring data and collaboration between teams.
Periodic remote sync-up meetings, acceptance and attendance to the meeting.
Ability to see stakeholders' availability of calendar time to schedule meetings.
Periodic (weekly, monthly) summary reports of the various infra, operations incident categories.
Communication channels and synchronization regularly and also upon critical issues, changes, upgrades, releases etc.
While DIGIT is deployed at state cloud infrastructure, it is essential to identify and distinguish the responsibilities between Infrastructure, Operations and Implementation partners. Identify these teams and assign SPOC, define responsibilities and ensure the Incident Management process is followed to visualize, track issues and manage dependencies between teams. Essentially these are monitored through dashboards and alerts are sent to the stakeholders proactively. eGov team can provide consultation and training on a need basis depending on any of the below categories.
State IT/Cloud team -Refers to state infra team for the Infra, network architecture, LAN network speed, internet speed, OS Licensing and upgrade, patch, compute, memory, disk, firewall, IOPS, security, access, SSL, DNS, data backups/recovery, snapshots, capacity monitoring dashboard.
State program team - Refers to the owner for the whole DIGIT implementation, application rollouts, and capacity building. Responsible for identifying and synchronizing the operating mechanism between the below teams.
Implementation partner - Refers to the DIGIT Implementation, application performance monitoring for errors, logs scrutiny, TPS on peak load, distributed tracing, DB queries analysis, etc.
Operations team - this team could be an extension of the implementation team that is responsible for DIGIT deployments, configurations, CI/CD, change management, traffic monitoring and alerting, log monitoring and dashboard, application security, DB Backups, application uptime, etc.
System Administration
Linux Administration, troubleshooting, OS Installation, Package Management, Security Updates, Firewall configuration, Performance tuning, Recovery, Networking, Routing tables, etc
4
Containers/Dockers
Build/Push docker containers, tune and maintain containers, Startup scripts, Troubleshooting dockers containers.
2
Kubernetes
Setup kubernetes cluster on bare-metal and VMs using kubeadm/kubespary, terraform, etc. Strong understanding of various kubernetes components, configurations, kubectl commands, RBAC. Creating and attaching persistent volumes, log aggregation, deployments, networking, service discovery, Rolling updates. Scaling pods, deployments, worker nodes, node affinity, secrets, configMaps, etc..
3
Database Administration
Setup PostGres DB, Set up read replicas, Backup, Log, DB RBAC setup, SQL Queries
3
Docker Registry
Setup docker registry and manage
2
SCM/Git
Source Code management, branches, forking, tagging, Pull Requests, etc.
4
CI Setup
Jenkins Setup, Master-slave configuration, plugins, jenkinsfile, groovy scripting, Jenkins CI Jobs for Maven, Node application, deployment jobs, etc.
4
Artifact management
Code artifact management, versioning
1
Apache Tomcat
Web server setup, configuration, load balancing, sticky sessions, etc
2
WildFly JBoss
Application server setup, configuration, etc.
3
Spring Boot
Build and deploy spring boot applications
2
NodeJS
NPM Setup and build node applications
2
Scripting
Shell scripting, python scripting.
4
Log Management
Aggregating system, container logs, troubleshooting. Monitoring Dashboard for logs using prometheus, fluentd, Kibana, Grafana, etc.
3
WordPress
Multi-tenant portal setup and maintain
2
Program Management
Responsible for driving the Transformation Vision for State Team Formation, reviewing them and resolving hurdles for the teams.
Program Leader
Overall responsibility to Drive Vision of the program.
Identify Success Metrics for the program and the budgets for it. Staff the teams with the right / capable people to drive the outcomes.
Define program Structure and ensure that the various teams work in tandem towards the Program Plan/ Schedule.
Review program Progress and remove bottlenecks for the Implementation Teams
Procurement
Help timely procurements of various items/ services needed for the Program
Program Manager
Plan, establish tracking mechanism,
Track and Manage Program activities,
Conduct reviews with various teams to drive the Program. Ensure that the efforts of various teams are aligned.
Escalate/ seek support as appropriate to the Program Leader.
Program Coordinator
Track progress of activities,
Help documentation of the Program team,
Coordinate meeting schedules and logistics.
Implementation Review
Reports to program leader
Ensures Processes and System adoption happens in the ULB
Ensures the Program metrics are headed in the right direction (Their responsibility will extend well beyond the technical rollout)
Domain Team
Finalize finance and other related processes for all ULBs, Provide Specific Inputs to Technical Implementation team, Capacity Building,
Data Preparation
Oversee UAT
Monitor data to identify process execution on ground, Identify improvement areas for the Finance function.
State Finance Accounting Leader
Should be a TRUSTED Line Function person, who can be the guide to all the Accounting Head at the ULBs.
Should be able to take decisions for the state on all ULB Finance processes and appropriate automation related to that.
Finance Advisors / Consultants/ Accounts officers
Finalise Standardised Finance processes that need to be there on the ground to realise the State's vision.
Technology Implementation Team
Technical Specialist team that has knowledge of the eGov Platform, technologies, the DIGIT modules.
Configure/ customise the product to the needs of the state. Integrate the product with other systems as needed and manage and support the State
Technical Program Manager
Has a good understanding of the eGov Platform/ Product.
Plans the Technical Track of the Product Manage Technical team Coordinates with various stakeholders during different phases of Implementation to get the Product ready for rollout in the ULBs. Plan and schedule activities as needed in the program.
He/She will be part of the Program Management team.
Business Analysts
Study and design State specific Accounting and other taxation Processes working with the Domain team.
Capture and document all Processes
Ensure that the Product will meet the needs of the State
Software Designers / Architects
Designing Software requirements based on the requirements finalised by the Business Analysts and leveraging platform as appropriate.
Business Analysts
Study and design State specific Processes working with the Domain team.
Capture and document all Processes and ensure that the Product will meet the needs of the State.
Software Designers / Architects
Designing Software requirements based on the requirements finalised by the Business Analysts and leveraging platform as appropriate.
Developers
Configurations, Customization and Data Loads.
Testers
Test configuration / customisation and regression testing for each release
Project Coordinator
Coordinate activities amongst the various stakeholder and logistics support
DevOps & Cloud Monitoring
Release Management, Managing Repository, Security and Build tools
DBA
Postgres DBA. Database Tuning, backup, Archiving
Field Team
Statewide capacity building (Including Change Management). Experience in Finance Area preferred.
Measure training effectiveness and fine-tune approach.
Plan refresher training as needed.
Content Developer
Prepare content for training different roles in DIGIT.
Trainers
Execute training as per content developed for the different roles in DIGIT.
Capture feedback and identify additional training needs if required
Help Desk and Support
Central help desk
Onground support in a planned manner to each ULB during the first 2 months after rolling out.
Help Desk leader
Organise and run the help desk operations.
Ensure that tickets are handled as per agreed SLAs, Coordinate with Technical team as needed.
Analyse Help desk calls and identify potential areas for the Domain / Business Analysts to work on.
Central Help Desk
To take care of L1 and L2 Support.
Ensure Tracking of issues on the help desk tool.
Provide On ground support (Face to face) during the first 2 months of rollout
At Least 1 person per 3-4 Ulbs who can travel during the first 2 months to provide support to end users. This is more for confidence building and ensuring adoption.
This section provides insights on security principles, security layers and the line of control that we focus on to prevent DIGIT security from the code, application, access, infra and operations. The target audience of this section are internal teams, partners, ecosystems and states to understand what security measures to be considered to secure DIGIT from an infrastructure and operations perspective .
Subscribe to the DIGIT applicable OWASP top 10 standard across various security layers.
Minimize attack surface area
Implement a strong identity foundation - Who accesses what and who does what.
Apply security at all possible layers
Automate security best practices
Separation of duties (SoD).
The principle of Least privilege (PoLP)
Templatized design - (Code, Images, Infra-as-code, Deploy-as-code, Conf-as-code, etc)
Align with MeiTY Standards to meet SDC Infra policies.
Application Layer
WAF, IAM, VA/PT, XSS, CSRF, SQLi, DDoS Defense.
Code
Defining security in the code, Static/Dynamic vulnerabilities scan
Libraries/Containers
Templatize Design, Vulnerabilities scanning at CI
Data
Encryption, Backups, DLP
Network
TLS, Firewalls, Ingress/Egress, Routing.
Infra/Cloud
Configurations/Infra Templates, ACL, user/privilege mgmt, Secrets mgmt
Operations
(PoLP) Least Privilege, Shared Responsibilities, CSA, etc
The presentation layer is likely to be the #1 attack vector for malicious individuals seeking to breach security defences like DDoS attacks, Malicious bots, Cross-Site Scripting (XSS) and SQL injection. Need to invest in web security testing with the powerful combination of tools, automation, process and speed that seamlessly integrates testing into software development, helping to eliminate vulnerabilities more effectively, deploy a web application firewall (WAF) that monitors and filters traffic to and from the application, blocking bad actors while safe traffic proceeds normally.
1. TLS-protocols/Encryption: Access control to secure authentication and authorization. All APIs that are exposed must have HTTPS certificates and encrypt all the communication between client and server with transport layer security (TLS).
2. Auth Tokens: An authorization framework that allows users to obtain admittance to a resource from the server. This is done using tokens in microservices security patterns: resource server, resource owner, authorization server, and client. These tokens are responsible for access to the resource before its expiry time. Also, Refresh Tokens that are responsible for requesting new access after the original token has expired.
3. Multi-factor Authentication: authorize users on the front end, which requires a username and password as well as another form of identity verification to offer users better protection by default as some aspects are harder to steal than others. For instance, using OTP for authentication takes microservice security to a whole new level.
4. Rate Limit/DDoS: denial-of-service attacks are the attempts to send an overwhelming number of service messages to cause application failure by concentrating on volumetric flooding of the network pipe. Such attacks can target the entire platform and network stack.
To prevent this:
We should set a limit on how many requests in a given period can be sent to each API.
If the number exceeds the limit, block access from a particular API, at least for some reasonable interval.
Also, make sure to analyze the payload for threats.
The incoming calls from a gateway API would also have to be rate-limited.
Add filters to the router to drop packets from suspicious sources.
5. Cross-site scripting (XSS): scripts that are embedded in a webpage and executed on the client side, in a user’s browser, instead of on the server side. When applications take data from users and dynamically include it in webpages without validating the data properly, attackers can execute arbitrary commands and display arbitrary content in the user’s browser to gain access to account credentials.
How to prevent:
Applications must validate data input to the web application from user browsers.
All output from the web application to user browsers must be encoded.
Users must have the option to disable client-side scripts.
6. Cross-Site Request Forgery (CSRF): is an attack whereby a malicious website will send a request to a web application that a user is already authenticated against from a different website. This way an attacker can access functionality in a target web application via the victim's already authenticated browser. Targets include web applications like social media, in-browser email clients, online banking and web interfaces for network devices. To prevent this CSRF tokens are appended to each request and associated to the user’s session. Such tokens should at a minimum be unique per user session, but can also be unique per request.
How to prevent:
By including a challenge token with each request, the developer can ensure that the request is valid and not coming from a source other than the user.
8. SQL Injection (SQLi): allows attackers to control an application’s database – letting them access or delete data, change an application’s data-driven behaviour, and do other undesirable things – by tricking the application into sending unexpected SQL commands. SQL injections are among the most frequent threats to data security.
How to prevent:
Using parameterized queries which specify placeholders for parameters so that the database will always treat them as data rather than part of an SQL command. Prepared statements and object-relational mappers (ORMs) make this easy for developers.
Remediate SQLi vulnerabilities in legacy systems by escaping inputs before adding them to the query. Use this technique only where prepared statements or similar facilities are unavailable.
Mitigate the impact of SQLi vulnerabilities by enforcing the least privilege on the database. Ensure that each application has its database credentials and that these credentials have the minimum rights the application needs.
The primary causes of commonly exploited software vulnerabilities are consistent defects, bugs, and logic flaws in the code. Poor coding practices can create vulnerabilities in the system that can be exploited by cybercriminals.
What defines a security in the code:
1. White-box code analysis: As developers write code, the IDE needs to provide focused, real-time security feedback with white-box code analysis. It also helps developers remediate faster and learn on the job through positive reinforcement, remediation guidance, code examples, etc.
2. Static Code Analysis (SAST): A static analysis tool reviews program code, searching for application coding flaws, back doors or other malicious code that could give hackers access to critical data or customer information. However, most static analysis tools can only scan source code.
3: Vulnerability assessment: Vulnerability assessment for the third-party libraries/artefacts as part of CI and GitHub PR process. Test results are returned quickly and prioritized in a Fix-First Analysis that identifies both the most urgent flaws and the ones that can be fixed most quickly, allowing developers to optimize efforts and save additional resources.
4. Secure PII/Encrypt: Personally identifying information – to make sure that it is not being displayed as plain text. All the passwords and usernames must be masked during the storing in logs or records. However, adding extra encryption above TLS/HTTP won’t add protection for traffic travelling through the wire. It can only help a little bit at the point where TLS terminates, so it can protect sensitive data (such as passwords or credit card numbers) from accidental dumping into a request log. Extra encryption (RSA 2048+ or Blowfish) might help protect data against those attacks that aim at accessing the log data. But it will not help with those who try accessing the memory of the application servers or the main data storage.
5. Manual Penetration Testing: Some categories of vulnerabilities, such as authorization issues and business logic flaws, cannot be found with automated assessments and will always require a skilled penetration tester to identify them. Need to employ Manual Penetration Testing that uses proven practices to provide extensive and comprehensive security testing results for web, mobile, desktop, and back-end with detailed results, including attack simulations.
Components, such as libraries, frameworks, container images, and other software modules, almost always run with full privileges. If a vulnerable component is exploited, such an attack can facilitate serious data loss or server takeover. Applications using components with known vulnerabilities may undermine application defences and enable a range of possible attacks and impacts.
Automating dependency checks for the libraries and container auditing, as well as using other container security processes as part of the CI periodically or as part of PRs can largely prevent these vulnerabilities. Subscribing to tools that comply with vulnerable library databases such as OSVDB, Node Security Project, CIS, National Vulnerability Database, and Docker Bench for Security can help identify and fix the vulnerabilities periodically. A private docker registry can help.
Data Security involves putting in place specific controls, standard policies, and procedures to protect data from a range of issues, including:
Enforced encryption: Encrypt, manage and secure data by safeguarding it in transit. Password-based, easy to use and very efficient.
Unauthorized access: Blocking unauthorized access plays a central role in preventing data breaches. Implementing Strong Password Policy and MFA.
Accidental loss: All data should be backed up. In the event of hardware or software failure, breach, or any other error to data; a backup allows it to continue with minimal interruption. Storing the files elsewhere can also quickly determine how much data was lost and/or corrupted.
Destruction: Endpoint Detection and Response (EDR) – provides visibility and defensive measures on the endpoint itself, when attacks occur on endpoint devices this can eliminate gaining access systems and avoid destruction of the data.
In microservices and the Cloud Native architectural approach, the explosion of ephemeral, containerized services that arise from scaling applications developed increases the complexity of delivery. Fortunately, Kubernetes was developed just for this purpose. It provides DevOps teams with an orchestration capability for managing the multitude of deployed services, with in-built automation, resilience, load balancing, and much more. It's perfect for the reliable delivery of Cloud Native applications. Below are some of the key areas to get more control to establish policies, procedures and safeguards through the implementation of a set of rules for compliance. These rules cover infra privacy, security, breach notification, enforcement, and an omnibus rule that deals with security compliance.
Strong stance on authentication and authorization
Role-Based Access Control (RBAC)
Kubernetes infrastructure vulnerability scanning
Hunting misplaced secrets
Workload hardening from Pod Security to network policies
Ingress Controllers for security best practices
Constantly watch your Kubernetes deployments
Find deviations from desired baselines
Should alert or deny on policy violation
Block/Whitelist (IP or DNS) connections before entering the workloads.
Templatize the deployment/secrets configs and serve as config-as-code.
Kubernetes brings new requirements for network security, because applications, that are designed to run on Kubernetes, are usually architected as microservices that rely on the network. They make API calls to each other. Steps must be taken to ensure proper security protocols are in place. The following are the key areas for implementing network security for a Kubernetes platform:
Container Groups: Coupled communication between grouped containers, is achieved inside the Pod that contains one or more containers.
Communication between Pods: Pods are the smallest unit of deployment in Kubernetes. A Pod can be scheduled on one of the many nodes in a cluster and has a unique IP address. Kubernetes places certain requirements on communication between Pods when the network has not been intentionally segmented. These requirements include:
Containers should be able to communicate with other Pods without using network address translation (NAT).
All the nodes in the cluster should be able to communicate with all the containers in the cluster.
The IP address assigned to a container should be the same that is visible to other entities communicating with the container.
Pods and Services: Since Pods are ephemeral in nature, an abstraction called a Service provides a long-lived virtual IP address that is tied to the service locator (e.g., a DNS name). Traffic destined for that service VIP is then redirected to one of the Pods and offers the service using that specific Pod’s IP address as the destination.
Traffic Direction: Traffic is directed to Pods and services in the cluster via multiple mechanisms. The most common is via an ingress controller, which exposes one or more service VIPs to the external network. Other mechanisms include node ports and even publicly-addressed Pods.
It is a procedural security that manages risk and encourages to view of operations from the perspective of an adversary to protect sensitive information from falling into the wrong hands. Following are a few best practices to implement a robust, comprehensive operational security program:
Implement precise change management processes: All changes should be logged and controlled so they can be monitored and audited.
Restrict access to network devices using AAA authentication: a “need-to-know” is a rule of thumb regarding access and sharing of information.
Least Privilege (PoLP): Give the minimum access necessary to perform their jobs.
Implement dual control: Those who work on the tasks are not the same people in charge of security.
Automate tasks: reduce the need for human intervention. Humans are the weakest link in any organization’s operational security initiatives because they make mistakes, overlook details, forget things, and bypass processes.
Incident response and disaster recovery planning: are always crucial components of a sound security posture, we must have a plan to identify risks, respond to them, and mitigate potential damages.
With SSH keys, you can connect to GitHub without supplying your username and personal access token at each visit. You can also use an SSH key to sign commits.
Open Your "Command prompt" or "Terminal".
Type below commands to generate SSH key
Now a .ssh folder is created in your home directory. Go to that directory.
copy the SSH key which we get after running the above commands.
open GitHub and add this SSH key as shown below:
open Settings and go to SSH and GPG keys
Click on New SSH key and paste it. Click on Add SSH key.
If you want check the private key, use
You can store a variety of projects in GitHub repositories, including open source projects. with open source projects you can share your code in repositories with others to track your work.
To create a new repository, click on + icon and New repository
Create your with repo with any name based on your code. Make it as public. Then anyone can able to see your code.
If you want to add a README file, click on add a README file. It is helpful to understand how does the code present in repo will be helpful.
Next click on create repository.
In eGovernments Foundations we are having multiple number of Teams. we can create independent teams to manage repository permissions and mentions for groups of people.
Only organization owners and maintainers can create team. Owners can also restrict creation permissions for all teams in an organization.
First sign in to your organization github account.
Once you sign in to your account and if you open view organization you can able to see the above page.
Click on Teams. You will see the below image.
Now, click on the New team
Fill the details as shown in the below image:
After creating team, you will able to see the below image.
If you click on members.you can add members to your team by providing their github username or mail.
Now, you have successfully created GitHub team.
You can create branch protection rule, such as requiring an approving review or passing status checks for all pull requests merged into the protected branch.
Go to the repository and click on new branch.
Here I have created a branch named DIGIT
After, go to that branch in the same repository.
Branch protection rule states that, how to manage the branch restrictions/permissions in GitHub.
NOTE : You must have admin access orelse you have to be a codeowner to make these changes for branch restrictions/permissions.
Open https://github.com and choose any repository.Go to the main page. Click on settings.
Click on branches
If you click on the Edit rules you can able to see the rules which are applied for that branch.you should follow the rules when ever you are going to made any changes to that branch and pushing it.
If you want to create new branch protection rule click on Add Rule.
The common restrictions we are following to merge branches are :
1.Requires pull request
2.Requires approvals from CODE OWNERS
Only the CODE OWNERS can have access to merge and makes changes to these rules.
In every branch of repository there will be a CODEOWNER file. The people inside the CODEOWNER file are responsible for code in repository.
People with admin or owner permissions can set up a CODEOWNERS file in a repository.
The people you choose as code owners must have write permissions for the repository.
When the code owner is a team, that team must be visible and it must have write permissions, even if all the individual members of the team already have write permissions directly, through organization membership, or through another team membership.
For every branch there will be a CODEOWNER file. Only they can able to write the code and able to merge the pull requests.
Go to any of your branch(DIGIT branch created previously) in a repository and click on new file and name it as CODEOWNERS
Click on "Create a new branch for this commit and start a pull request" and click on propose new file
Next click on Create pull request and then Merge pull request and confirm merge.
Add the GitHub Id's of all the team or people whom you want to add.
You can create and register an OAuth App under your personal account or under any organization you have administrative access to. While creating your OAuth app, remember to protect your privacy by only using information you consider public.
Note: A user or organization can own up to 100 OAuth apps.
In the upper-right corner of any page, click your profile photo, then click Settings.
In the left sidebar, click Developer settings.
In the left sidebar, click OAuth Apps.
Click New OAuth App.
Note: If you haven't created an app before, this button will say, Register a new application.
In "Application name", type the name of your app.
Warning: Only use information in your OAuth app that you consider public. Avoid using sensitive data, such as internal URLs, when creating an OAuth App.
In "Homepage URL", type the full URL to your app's website.
Optionally, in "Application description", type a description of your app that users will see.
In "Authorization callback URL", type the callback URL of your app.
Note: OAuth Apps cannot have multiple callback URLs, unlike GitHub Apps.
If your OAuth App will use the device flow to identify and authorize users, click Enable Device Flow. For more information about the device flow, see "Authorizing OAuth Apps."
Click Register application.
You can invite anyone to become a member of your organization (whether they are already member in another organization) using their username or email address for GitHub.com.
In the top right corner of GitHub.com, click your profile photo, then click Your organizations.
Click the name of your organization
After that click on People
Next, Click on Invite member
Type the username, full name, or email address of the person you want to invite and click Invite.
Go to the repository and click on settings
Next click on Collaborators and teams.
Provide access to edit the code based on the user request.
Skills Needed:
How to verify DIGIT is running and ready for use
Once DIGIT is installed, check the health of the system to ensure it is ready for usage:
All pods should be in "running" state.
To move docker images from one container to another container.
Install Docker in your local machine.
Docker hub account.
To move the existing docker images from one account to another account by changing tags.
First, we have to login to the docker account in which the images are present.
We need to pull the image from the docker container to local machine.
Next, we have to change the tag name to our required docker container tag
Now, we have our required images with tags in our local machine. We need to push these images from local machine to destination container. First, login to the destination account using the above docker login command and then push the image using below command.
Once successfully pushed, if you check in your docker hub account the images will be present.
How to check if Infra is working as expected?
How to monitor and setup alerts? Other debugging tools?
Solutions to common problems and next steps
Monitoring how-to
Debugging
Fixing/escalating
DB monitoring, alerting and debugging guidelines
Monitor, debug, fix
What are the metrics to track for Kafka, Postgres and ES?
How/what to track?
Backbone services - Kafka, DB
Infra
Core services
Applications
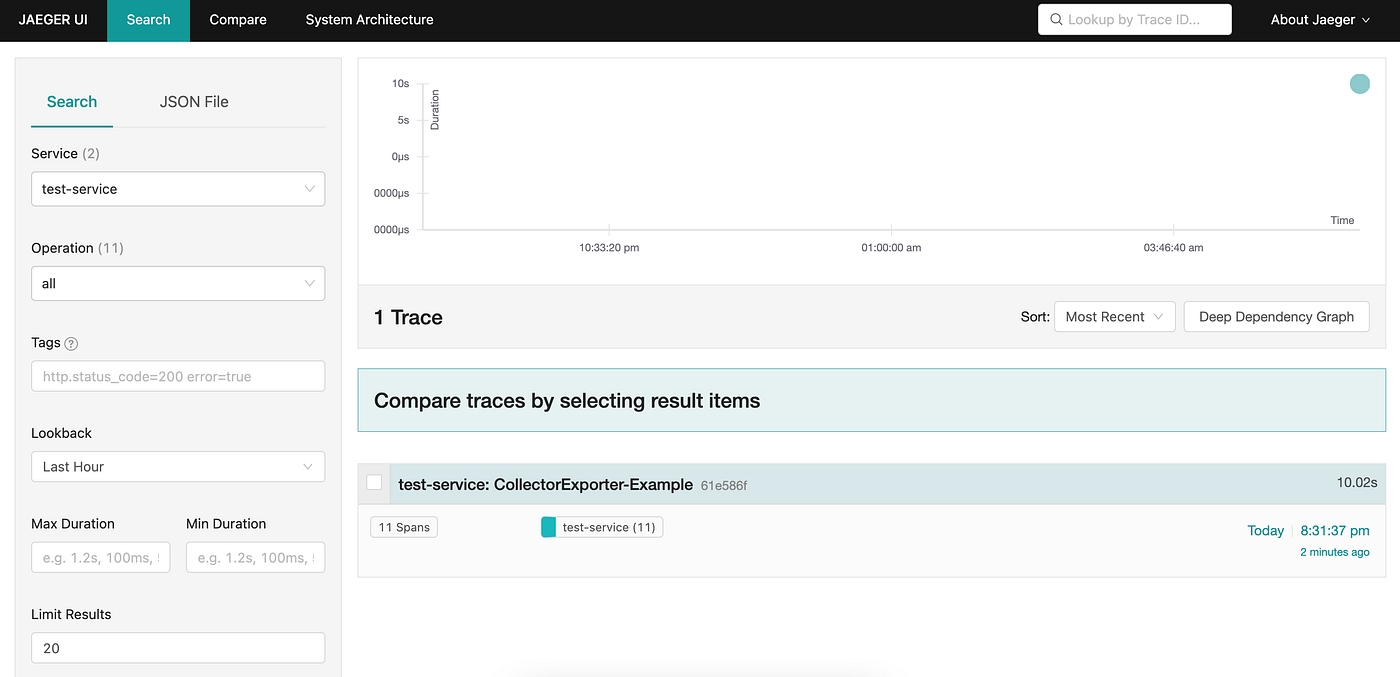
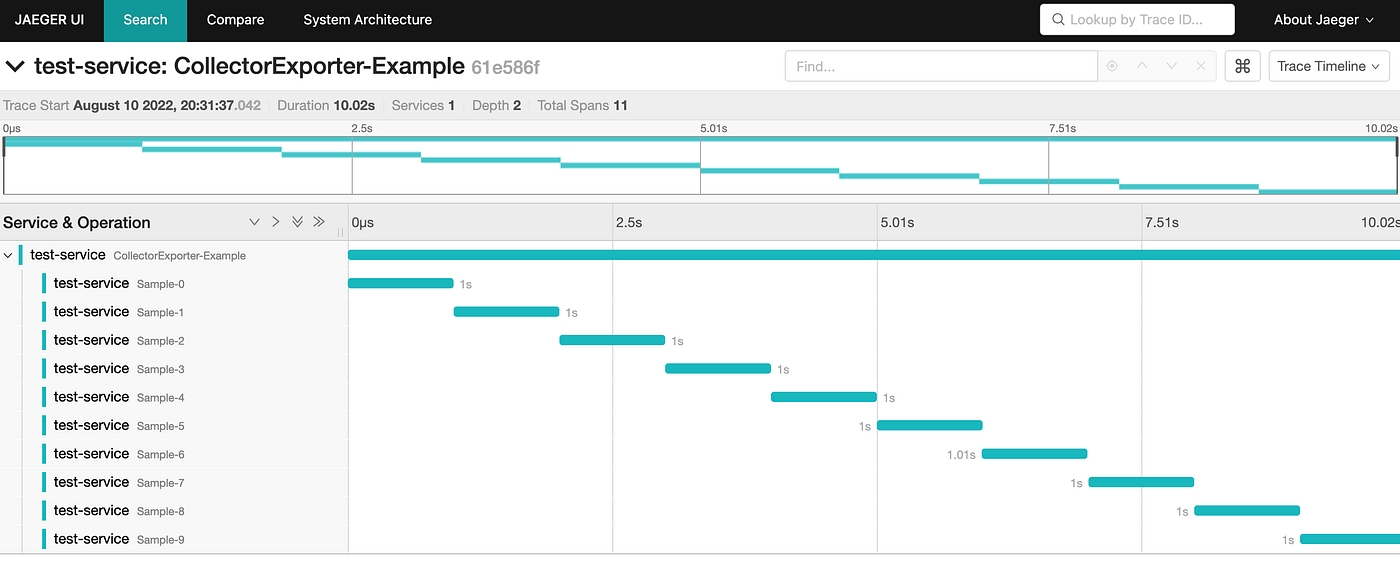
Use tracing to track core service APIs. Add info on Jaeger.
In this document we are customizing the sample-aws terraform template to setup the DIGIT infra in aws.
Install Visualstudio IDE Code for better code/configuration editing capabilities
Install Terraform v0.14.10.
Install AWS CLI.
Clone the DIGIT-DevOps repo
Here we are using AWS cloud service provider to create terraform infra. So, we are choosing sample-aws module (Terraform module is a collection of standard configuration files in a dedicated directory).
Open sample-aws in visual studio using the below command.
In that sample-aws module we can find the below terraform templates
main.tf will contain the main set of configuration for your module.
outputs.tf will contain the output definitions for your module. Module outputs are made available to the configuration using the module, so they are often used to pass information about the parts of your infrastructure defined by the module to other parts of your configuration.
providers.tf allow terraform to interact with cloud providers,SAAS providers. In this sample-aws our provider is aws.
variables.tf will contain the variable definitions for your module. When your module is used by others, the variables will be configured as arguments in the module block. Since all Terraform values must be defined, any variables that are not given a default value will become required arguments. Variables with default values can also be provided as module arguments, overriding the default value.
To setup the DIGIT infra we made changes in variables.tf. Open variables.tf in visual studio using the below code.
Change the values in variables.tf which are specified to replace based on our requirements.For example: cluster_name, network_availability_zones, availability_zones, ssh_key_name, db_name, db_username.
After customizing the values in variables.tf configure the aws credentials using the below commands.
Provide AWS access key id,AWS secret access key,Default region and Default output format.
Set aws_session _token using the below command.
To make sure that aws credentials are configured use the below command.
The output should be similar to the below image.
After that run the below commands in the terminal one after another.
terraform init is used to initialize your code to download the requirements mentioned in your code.
terraform plan is used to review changes and choose whether to simply accept them or not.
terraform apply is used to accept changes and apply them against real infrastructure.
After successfully running these commands we are able to set up the infra in aws. We are able to see the config file which is used to deploy the environment.
Want to destroy the terraform use the below command.
Jenkins for Build, Test and Deployment Automation
While we are adopting the Microservices architecture, it also demands to have an efficient CI/CD tools like jenkins. Along the cloud-native application developement and deployment jenkins can also be run cloud-native.
Since all processes, including software build, test and deployment, are performed every two or four weeks, this is an ideal playground for automation tools like Jenkins: After the developer commits a code change to the repository, Jenkins will detect this change and will trigger the build and test process. So Let's setup Jenkins as a docker container. Step-by-step.
VM or EC2 Instance or a Standalone on-premisis machin
Docker 1.12.1
Jenkins 2.32.2
Job DSL Plugin 1.58
Ubuntu or an Liniux Machine
Free RAM for the a VM/Machine >~ 4 GB.
Docker Host is available.
Tested with 3 vCPU (2 vCPU might work as well).
If you are using an host already has docker installed, you can skip this step. Make sure that your host has enough memory.
We will run Jenkins in a Docker container in order to allow for maximum interoperability. This way, we always can use the latest Jenkins version without the need to control the java version used.
If you are new to Docker, you might want to read this blog post.
Installing Docker on Windows and Mac can be a real challenge, but possible: here we will see an efficient way by using linux machine.
Prerequisites of this step:
I recommend to have direct access to the Internet: via Firewall, but without HTTP proxy.
Administration rights on you computer.
This extra download step is optional, since the Docker image will be downloaded automatically in step 3, if it is not already found on the system:
The version of the downloaded Jenkins image can be checked with following command:
We are using version 2.9.13 currently. If you want to make sure that you use the exact same version as I have used in this blog, you can use the imagename jenkins:2.19.3 in all docker commands instead of jenkins only.
Note: The content of the jenkins image can be reviewed on this link. There, we find that the image has an entrypoint
/bin/tini -- /usr/local/bin/jenkins.sh, which we could override with the--entrypoint bashoption, if we wanted to start a bash shell in the jenkins image. However, in Step 3, we will keep the entrypoint for now.
In this step, we will run Jenkins interactively (with -it switch instead of -d switch) to better see, what is happening. But first, we check that the port we will use is free:
Since we see that one of the standard ports of Jenkins (8080, 50000) is already occupied and I do not want to confuse the readers of this blog post by mapping the port to another host port, I just stop the cadvisor container for this „hello world“:
Jenkins will be in need of a persistent storage. For that, we create a new folder on the Docker host:
Note: The content of the jenkins image can be reviewed on this link. There, we find that the image has an entrypoint
/bin/tini -- /usr/local/bin/jenkins.sh, which we could override with the--entrypoint bashoption, if we wanted to start a bash shell in the jenkins image.
We start the Jenkins container with the jenkins_home Docker host volume mapped to /var/jenkins_home:
Now we want to connect to the Jenkins portal. For that, open a browser and open the URL
In our case, Jenkins is running in a container and we have mapped the container-port 8080 to the local port 8080 of the Docker host. On the Docker host, we can open the URL.
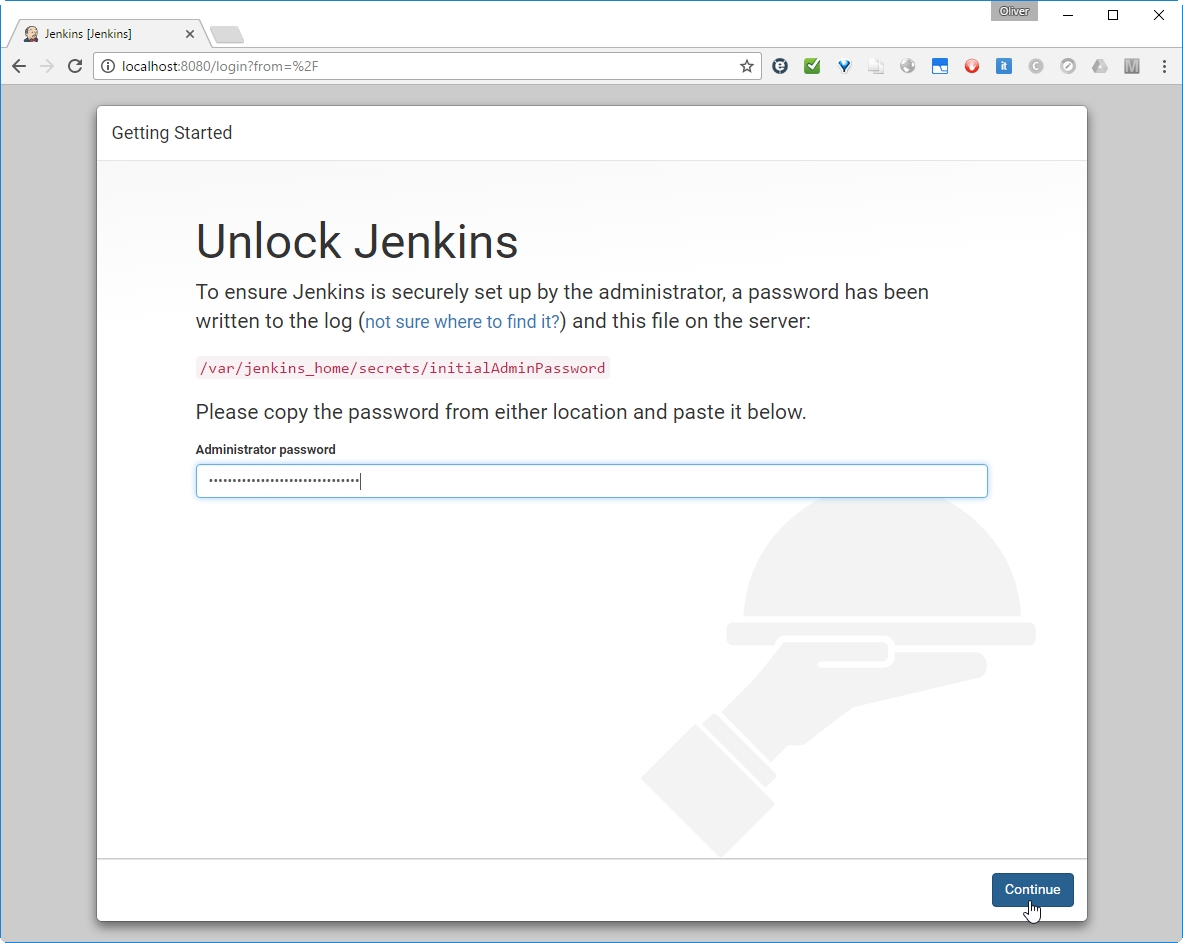
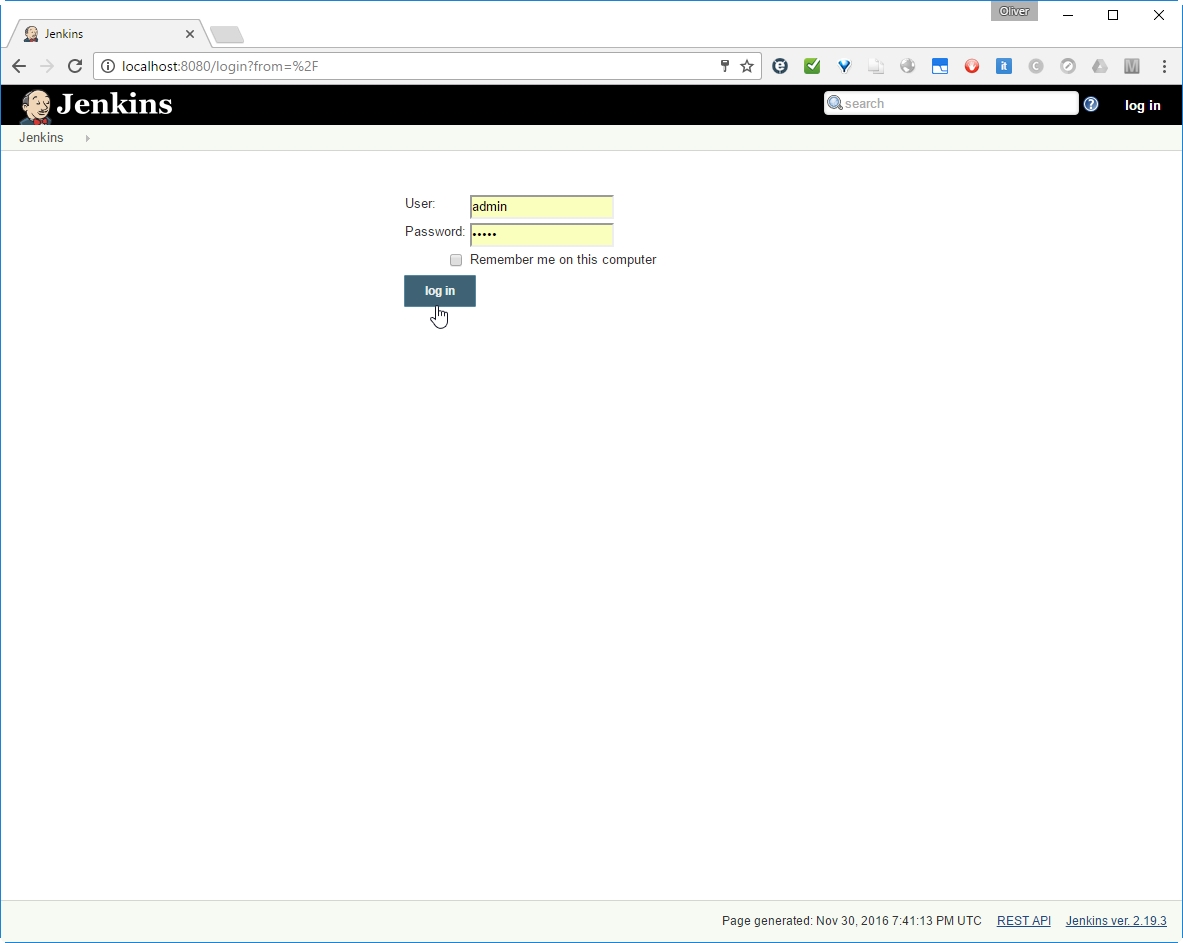
The Jenkins login screen will open:
The admin password can be retrieved from the startup log, we have seen above (0c4a8413a47943ac935a4902e3b8167e), or we can find it by typing
on the mapped jenkins_home folder on the Docker host.
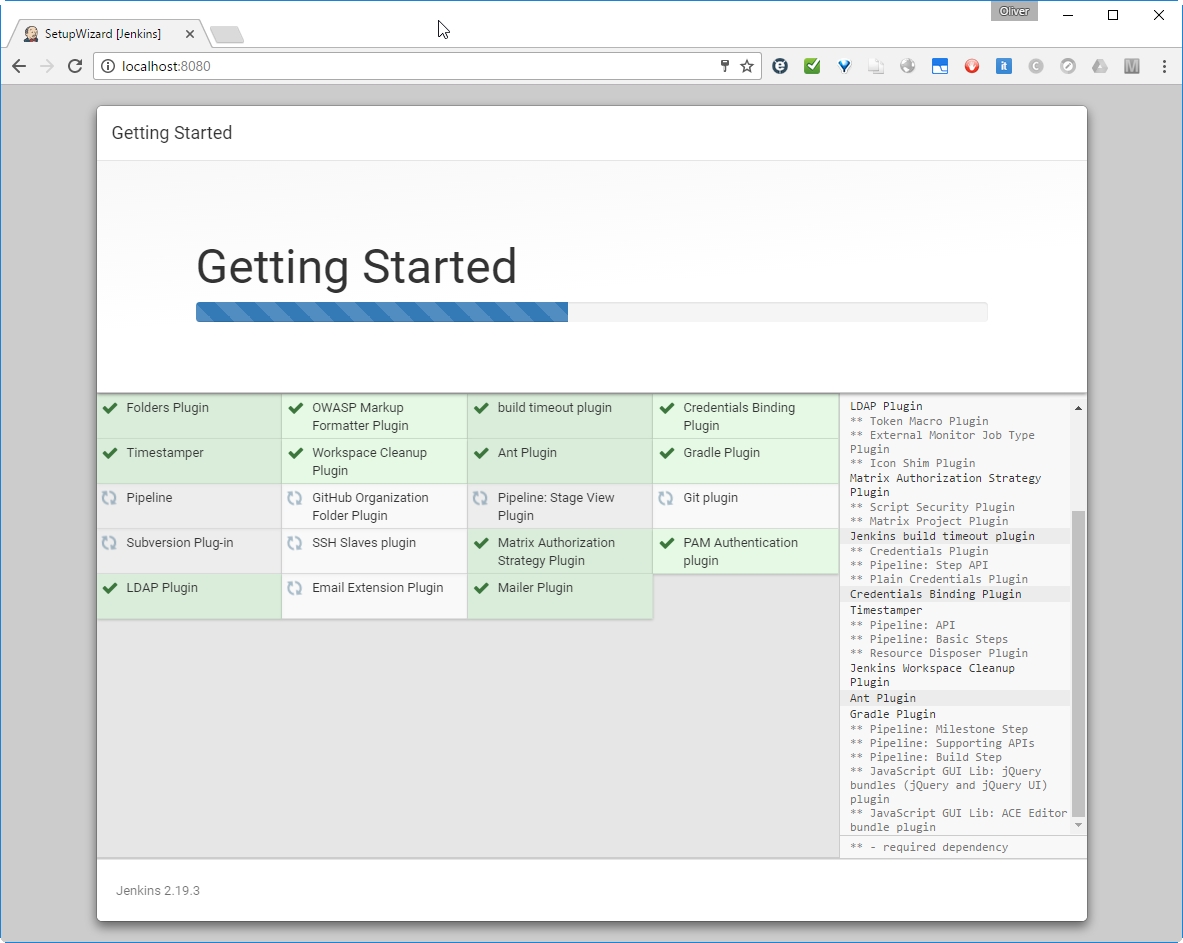
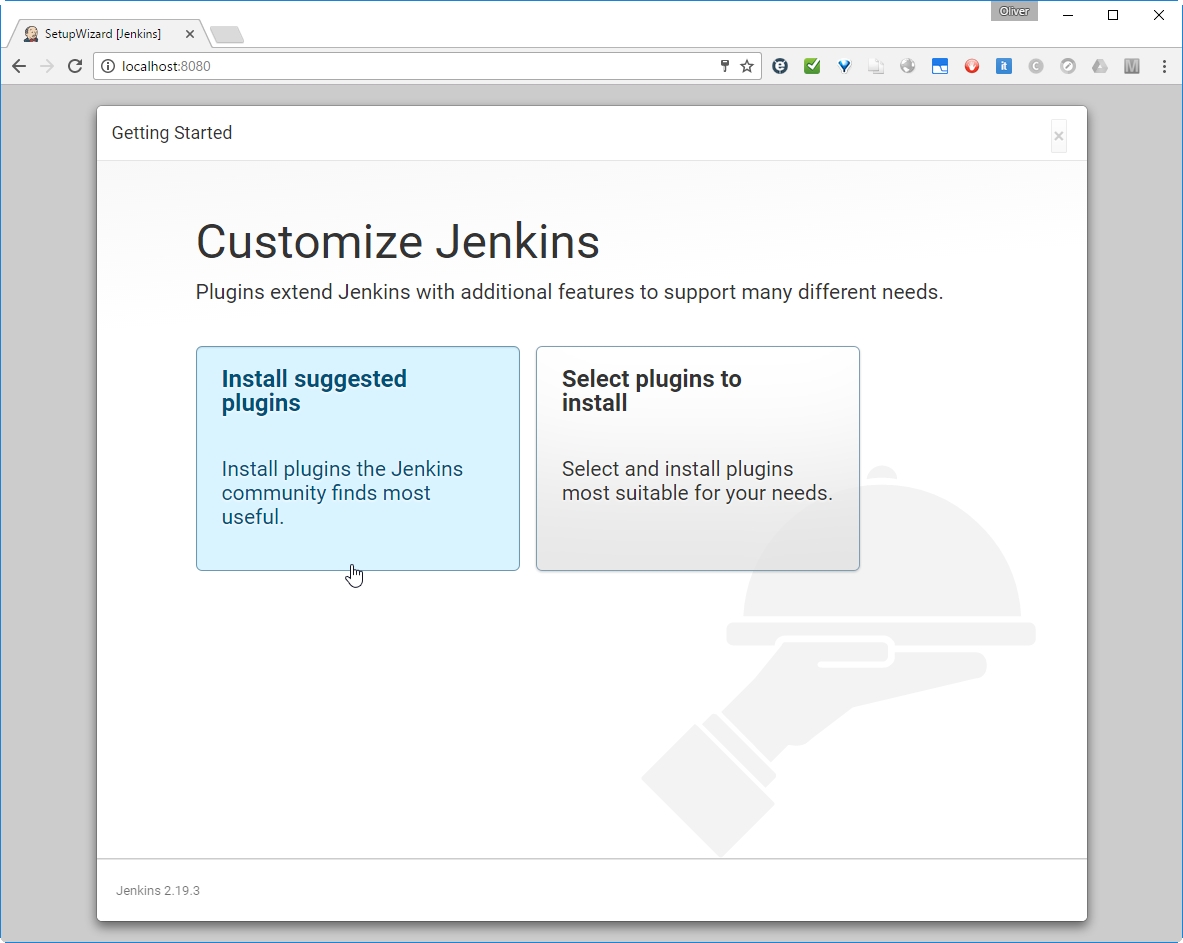
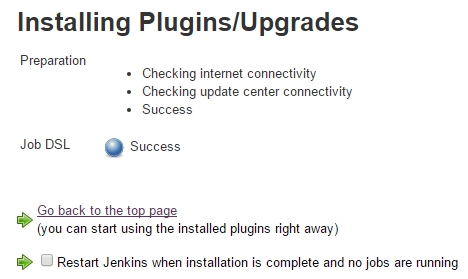
Let us install the suggested plugins:
This may take a while to finish:
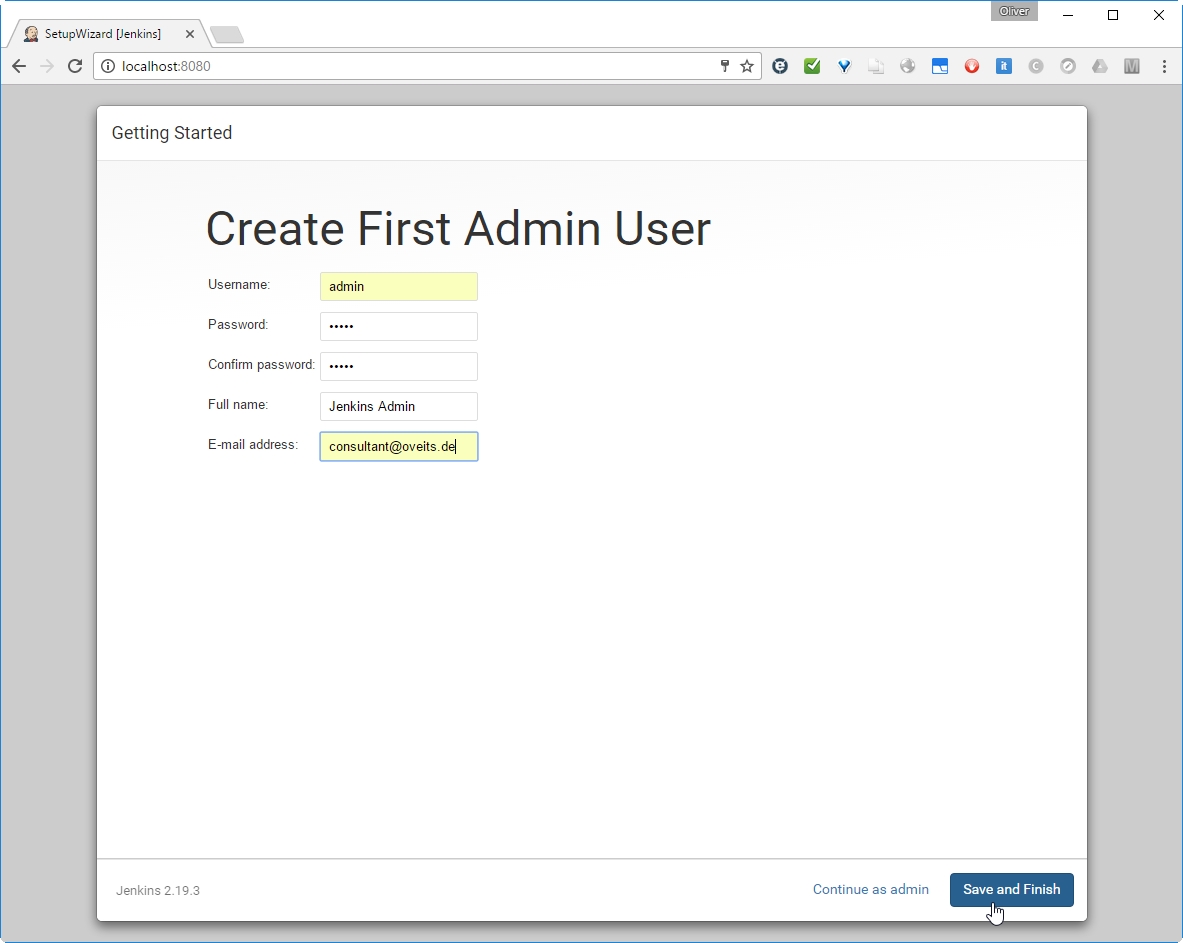
Then we reach a page, where we can create an Admin user:
Let us do so and save and finish.
Note: After this step, I have deleted the Jenkins container and started a new container attached to the same Jenkins Home directory. After that, all configuration and plugins were still available and we can delete containers after usage without loosing relevant information.
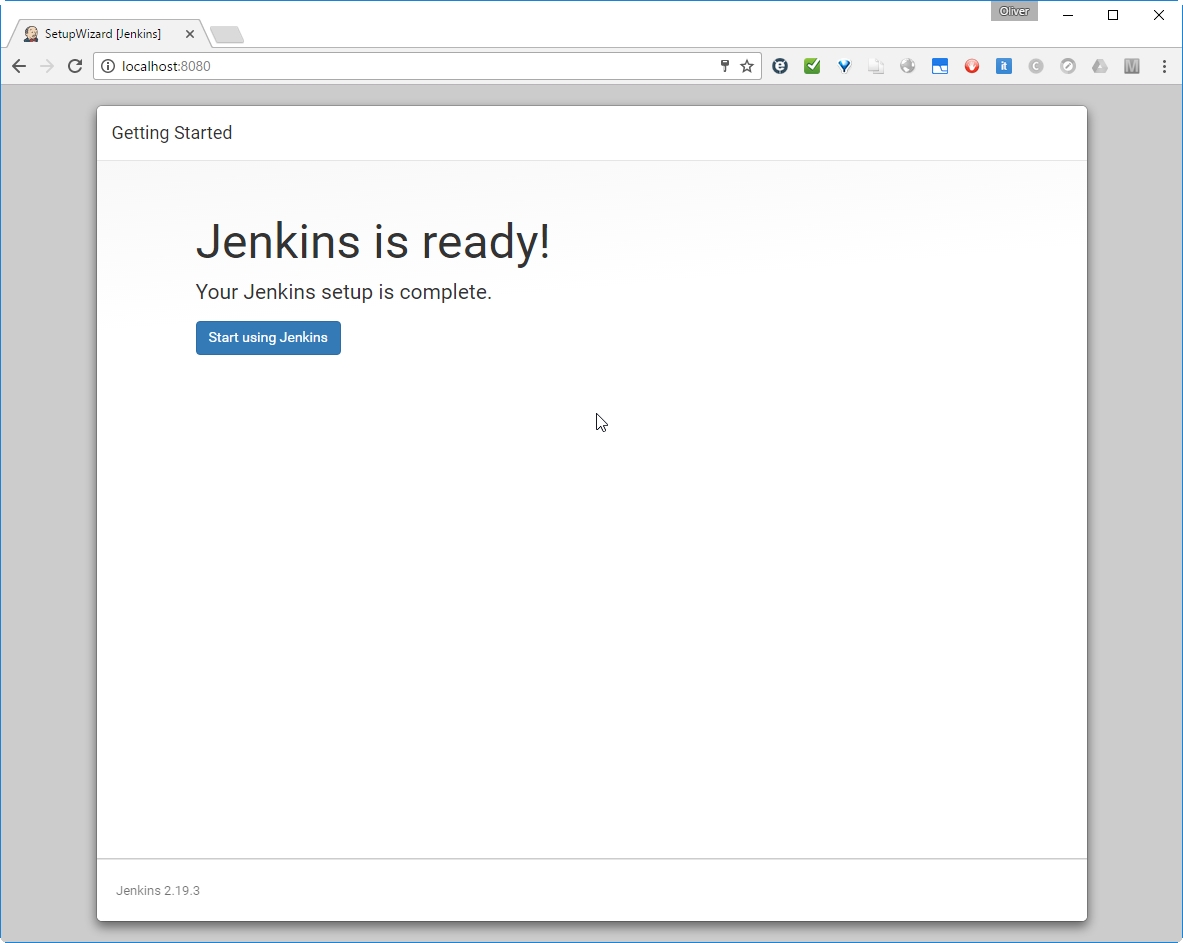
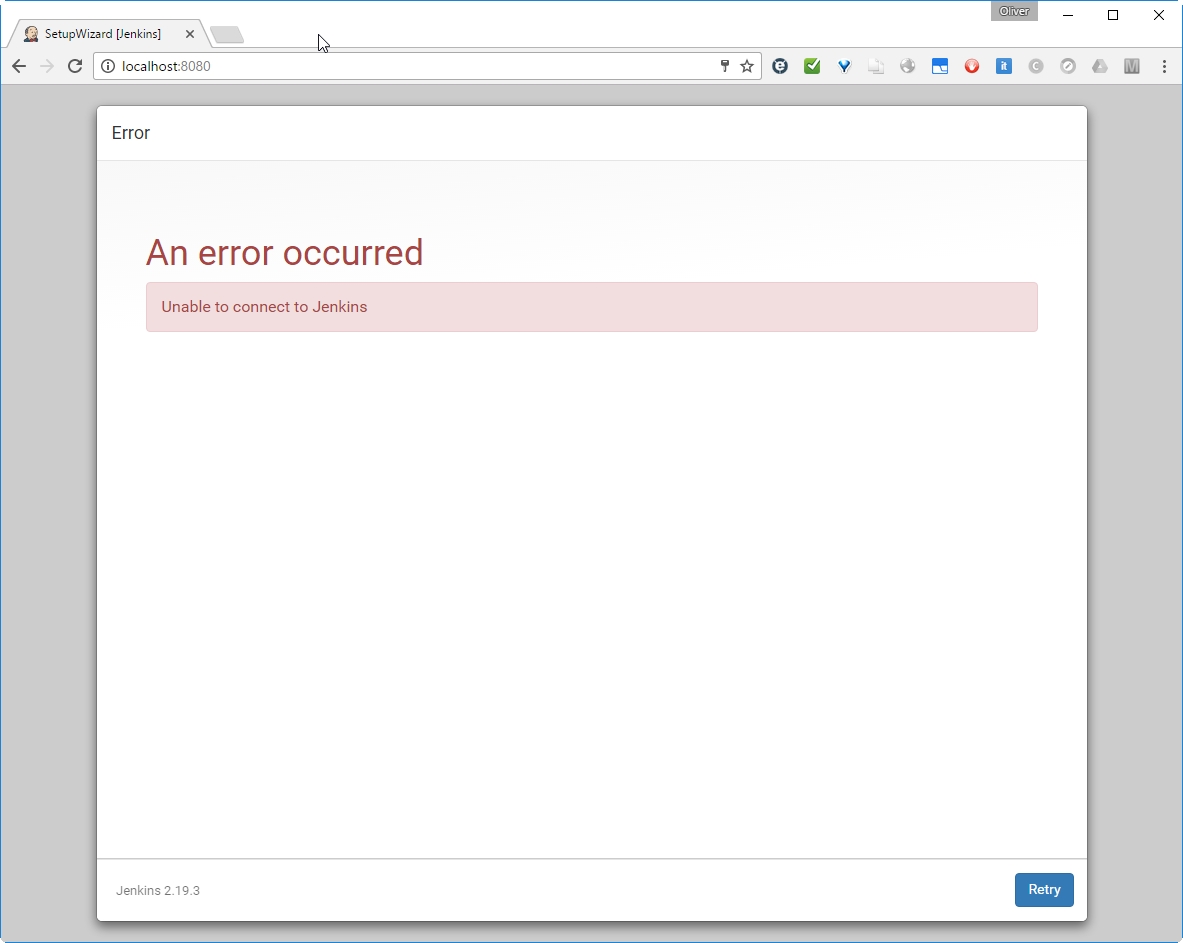
I have had a dinner break at this point. Maybe this is the reason I got following message when clicking the „Start using Jenkins“ button?
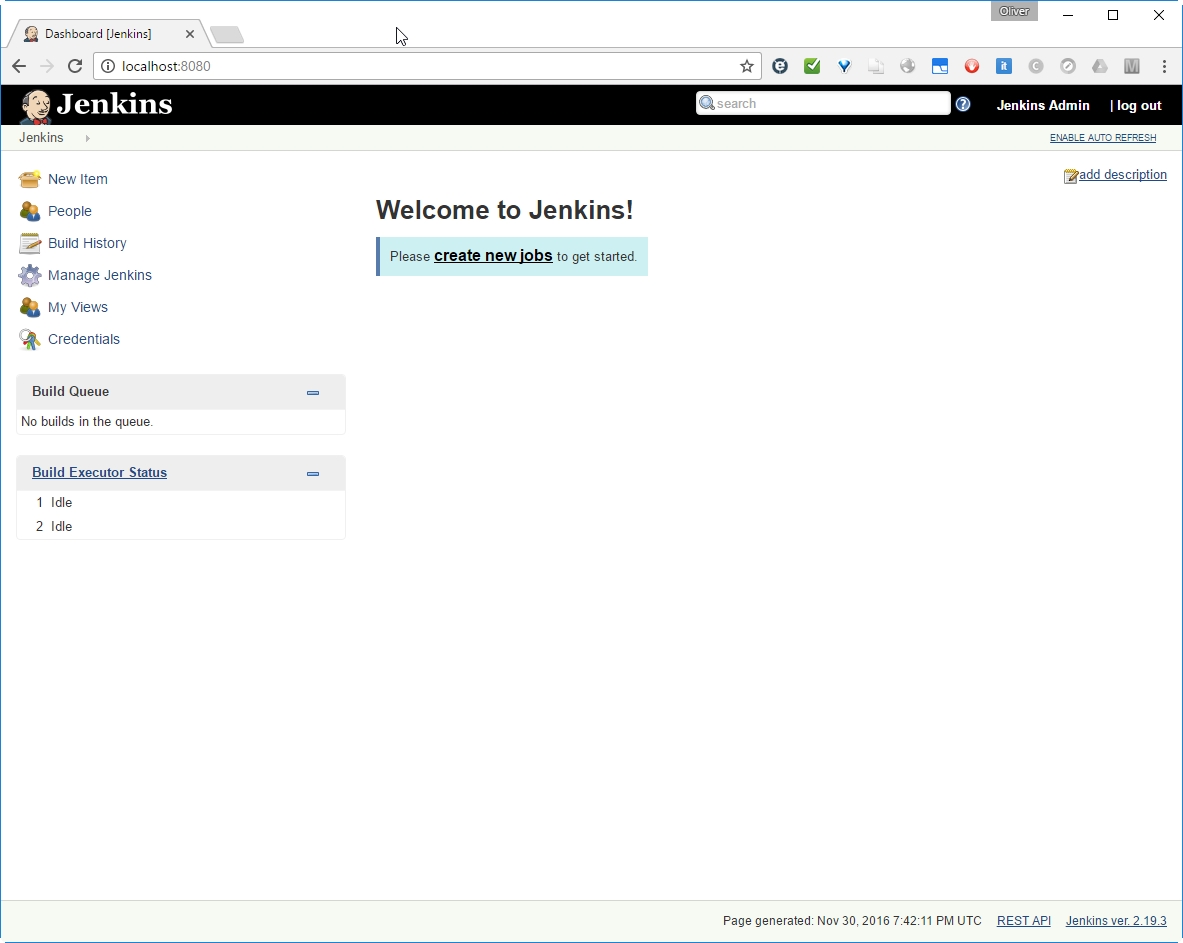
What ever. After clicking „retry“, we reach the login page:
In the nex, we will create our first Jenkins job. I plan to trigger the Maven and/or Gradle build of a Java executable file upon detection of a code change.
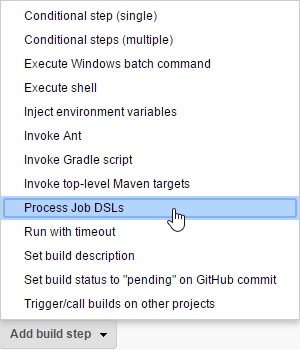
The Job DSL Plugin can be installed like any other Jenkins plugin:
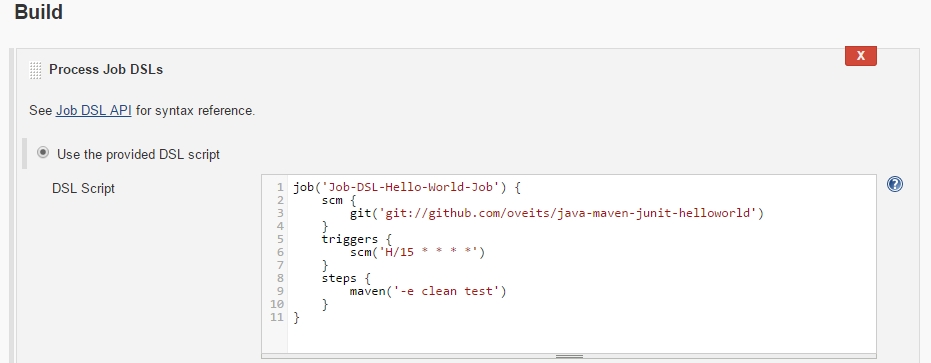
We create a Job DSL Job like follows:
-> if you have got a Github account, fork this open source Java Hello World software (originally created by of LableOrg) that will allow you to see, what happens with your Jenkins job, if you check in changed code. Moreover the hello world software allows you to perform JUnit 4 tests, run PowerMockito Mock services, run JUnit 4 Integration tests and calculate the code coverage using the tool Cobertura.
-> insert:
here, exchange the username oveits by your own Github username.\
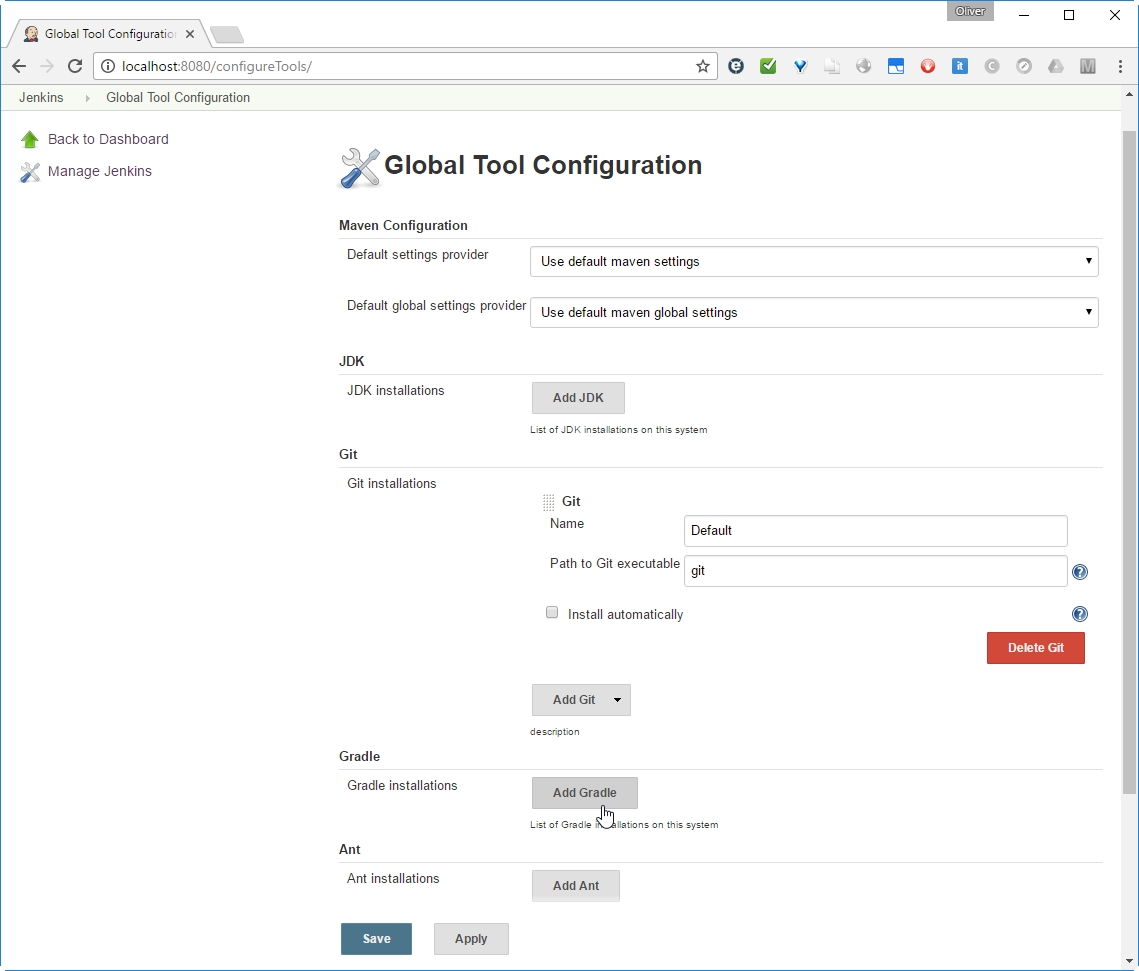
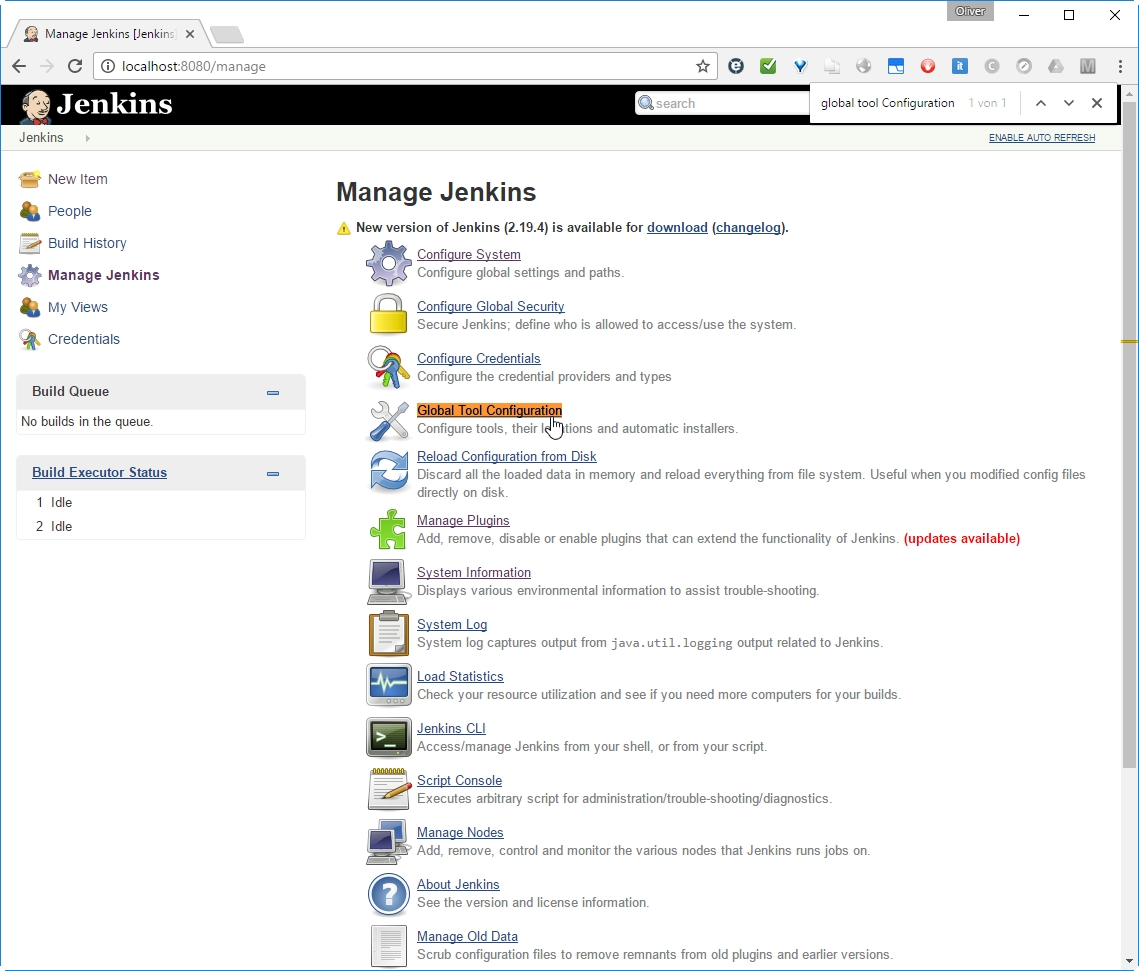
Goto Jenkins -> Manage Jenkins -> Global Tool Configuration (available for Jenkins >2.0)
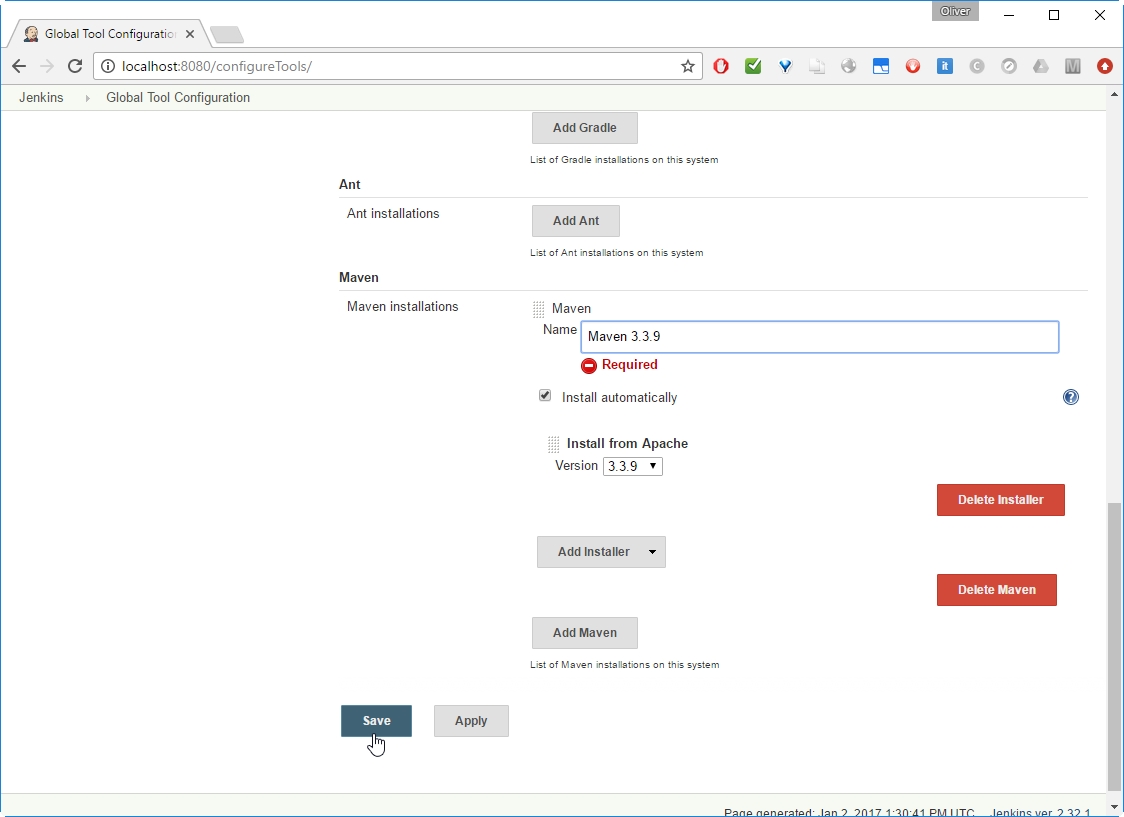
-> choose Version (3.3.9 in my case)
-> Add a name („Maven 3.3.9“ in my case)
Since we have checked „Install automatically“ above, I expect that it will be installed automatically on first usage.
As described in this StackOverflow Q&A, we need to add the Git username and email address, since Jenkins tries to tag and commit on the Git repo, which requires those configuration items to be set. For that, we perform:
-> scroll down to „Git plugin“
->
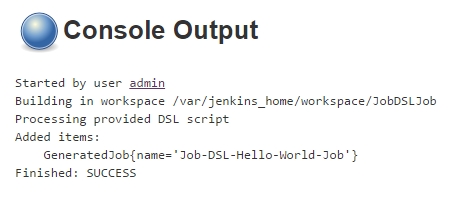
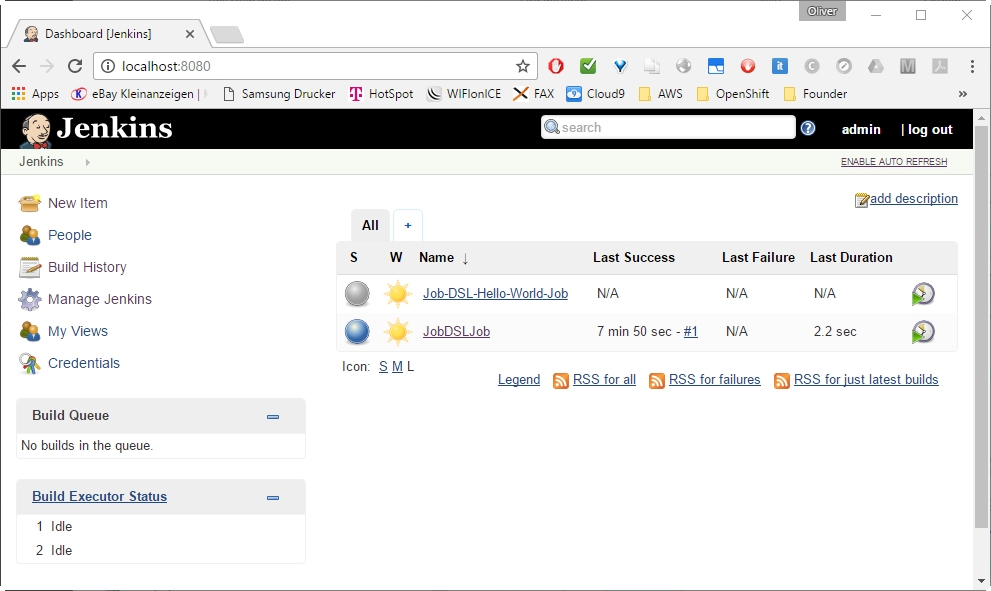
This is showing a build failure, since I had not performed Step 5 and 6 before. In your case, it should be showing a success (in blue). If you are experiencing problems here, check out the Appendices below.
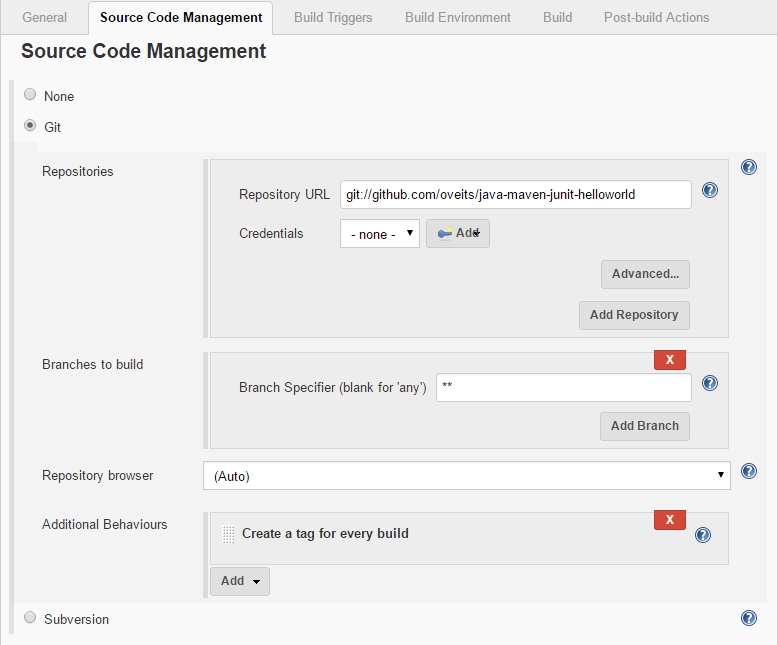
-> scroll down to Source Code Management
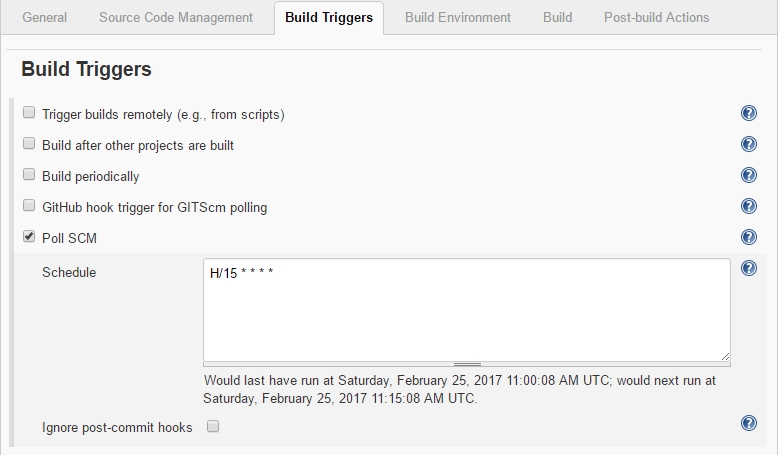
-> Scroll down to Build Triggers
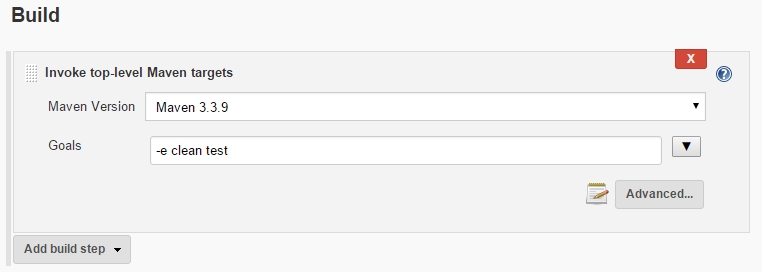
-> Scroll down to Build
-> verify that „Maven 3.3.9“ is chosen as defined in Step 5
-> enter „-e clean test“ as Maven Goal
See, what happens by clicking on:
-> Build History
-> #nnn
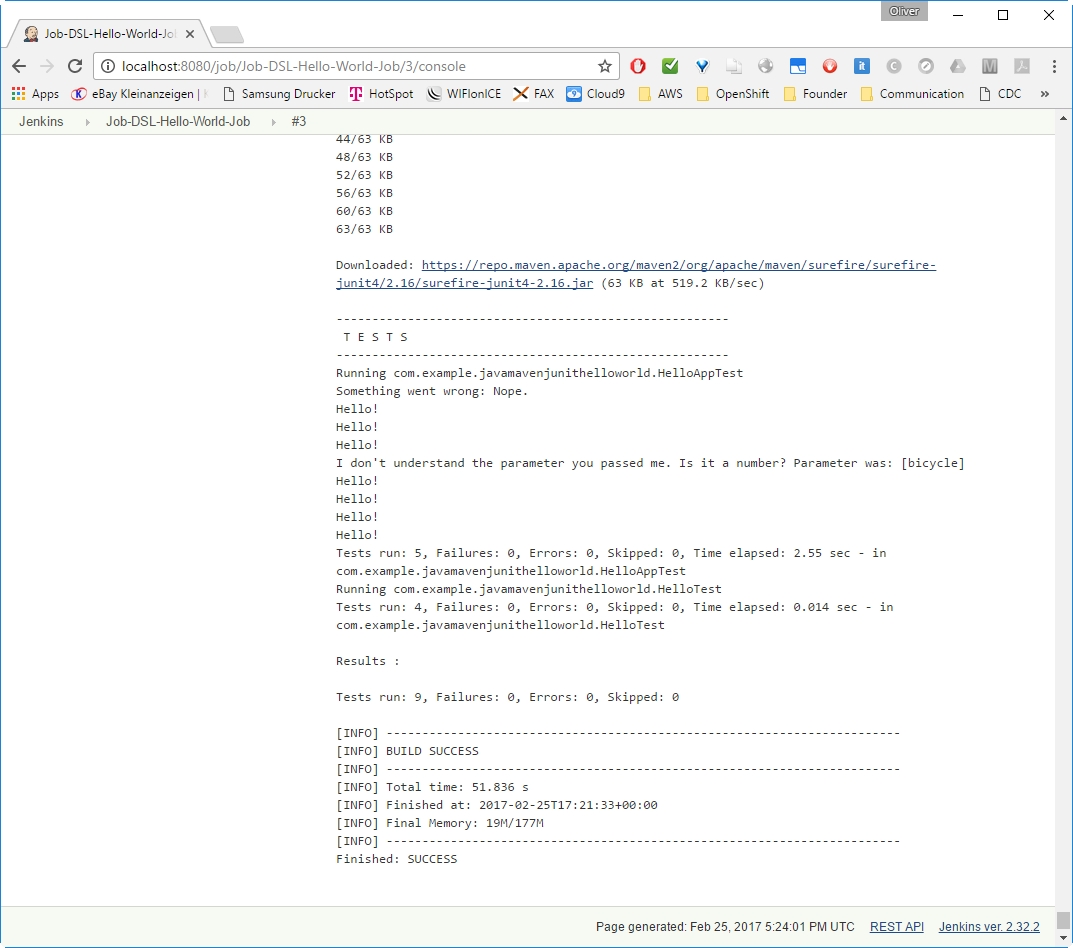
If everything went fine, we will see many downloads and a „BUILD SUCCESS“:
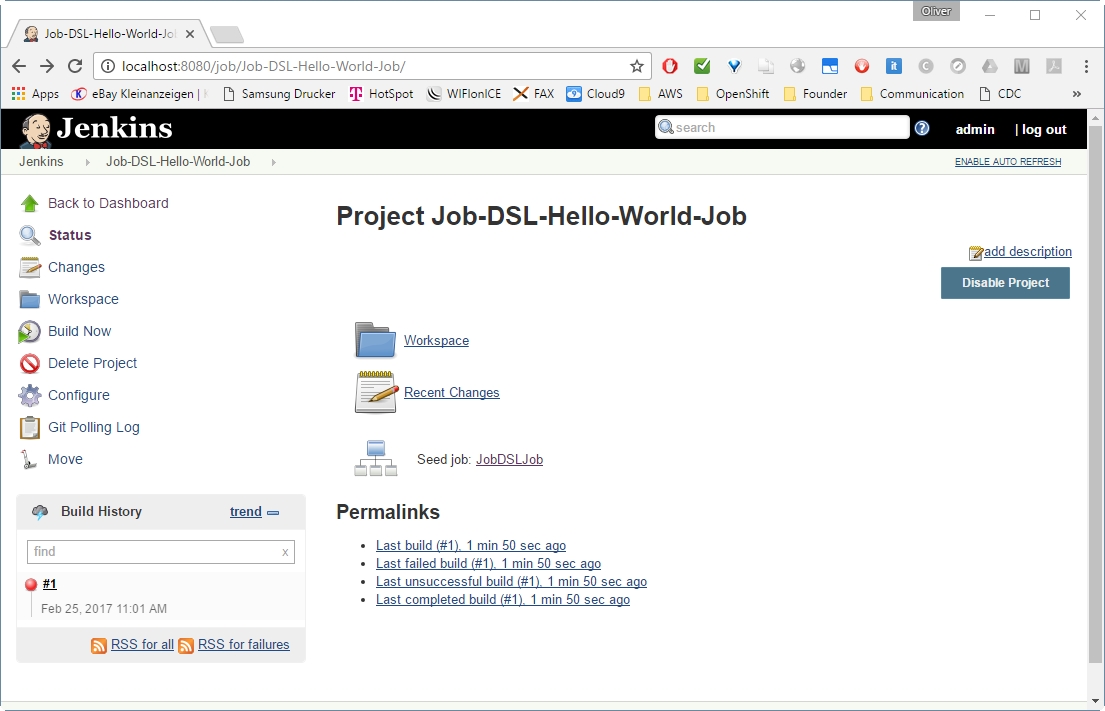
In a new installation of Jenkins, Git does not seem to work out of the box. You can see this by choosing the Jenkins project Job-DSL-Hello-World-Job on the dashboard, then click „build now“, if the build was not already automatically triggered. Then:
-> Build History
-> Last Build (link works only, if Jenkins is running on localhost:8080 and you have chosen the same job name)
There, we will see:
As described in this StackOverflow Q&A: we can resolve this issue by either suppressing the git tagging, or (I think this is better) by adding your username and email address to git:
-> scroll down to „Git plugin“
Step 2: Re-run „Build Now“ on the Project
To test the new configuration, we go to
-> the Job-DSL-Hello-World-Job and press
Now, we should see a BUILD SUCCESS like follows:
-> Build History
-> #nnn
If everything went fine, we will a „BUILD SUCCESS“:
When running a Maven Goal, the following error may appear on the Console log:
Resolution:
Perform Step 5
and
For Test, you can test a manual: choose the correct Maven version, when configuring a Maven build step like in Step 7:
For our case, we need to correct the Job DSL like follows:
In the Script, we had defined the step:
However, we need to define the Maven Installation like follows:
Here, the mavenInstallation needs to specify the exact same name, as the one we have chosen in Step 5 above.
After correction, we will receive the correct Maven goal
Now, we can check the Maven configuration:
After scrolling down, we will see the correct Maven Version:
DONE
Updating Jenkins (in my case: from 2.32.1 to 2.32.2) was as simple as following the steps below
Note: you might want to make a backup of your jenkins_home though. Just in case…
However, after that, some data was unreadable:
I have clicked
to resolve the issue (hopefully…). At least, after that, the warning was gone.
The reference for the Job DSL syntax can be found on the Job DSL Plugin API pages. As an example, the syntax of Maven within a Freestyle project can be found on this page found via the path
> freeStyleJob > steps > maven:
// Allows direct manipulation of the generated XML.
configure(Closure configureBlock)
// Specifies the goals to execute including other command line options.
goals(String goals)
// Skip injecting build variables as properties into the Maven process.
injectBuildVariables(boolean injectBuildVariables = true)
// Set to use isolated local Maven repositories.
localRepository(javaposse.jobdsl.dsl.helpers.LocalRepositoryLocation location)
// Specifies the Maven installation for executing this step.
mavenInstallation(String name)
// Specifies the JVM options needed when launching Maven as an external process.
mavenOpts(String mavenOpts)
// Adds properties for the Maven build.
properties(Map props)
// Adds a property for the Maven build.
property(String key, String value)
// Specifies the managed global Maven settings to be used.
providedGlobalSettings(String settingsIdOrName)
// Specifies the managed Maven settings to be used.
providedSettings(String settingsIdOrName)
// Specifies the path to the root POM.
rootPOM(String rootPOM)
A Maven example can be found on the same page:
In this blog post, we have learned how to
Start and initialize Jenkins via Docker
Prepare the usage of Git and Maven
Install the Job DSL Plugin
Define a Jenkins Job via Groovy script
Create a Jenkins Job by a push of the „Build now“ button
Review and run the automatically created Jenkins job
We have seen that the usage of the Job DSL is no rocket science. The only topic, we had to take care, is, that Git and Maven need to be prepared for first usage on a Jenkins server.
\
Unlike rolling upgrades, direct upgrades involve migrating from an older version to a newer one in a single coordinated operation.
This comprehensive guide outlines the step-by-step process for deploying an Elasticsearch 8.11.3 cluster with enhanced security features. The document not only covers the initial deployment of the cluster but also includes instructions for seamlessly migrating data from an existing Elasticsearch cluster to the new one, allowing for a direct upgrade.
Clone the DIGIT-DevOps repo and checkout to the branch digit-lts-go.
If you want to make any changes to the elasticsearch cluster like namespaces etc. You'll find the helm chart for elastic search in the path provided below. In the below chart, security is enabled for elasticsearch. If you want to disable the security, please set the environment variable xpack.security.enabled as false in the helm chart statefulset template.
Elasticsearch secrets have been present in cluster configs chart since indexer, inbox services etc have dependency on elasticsearch secrets. Below is the template.
In cluster-configs values.yaml, add the namespaces in which you want to deploy the elasticsearch secrets.
Add the elasticsearch password in the env-secrets.yaml file, if not it will automatically creates a random password which will be updated everytime you deploy the elasticsearch.
Deploy the Elastic Search Cluster using the below commands.
Check the pods status using the below command.
Once all pods are running, execute the below commands inside the playground pod to dump data from the old elasticsearch cluster and restore it to the new elasticsearch cluster.
Using the above script, you can take the data dump from the old cluster and restore it in the new elasticsearch in a single command.
After restoring the data successfully in the new elasticsearch cluster, check the cluster health and document count using the below command.
Now the deployment and restoring the data are completed successfully. It's time to change the es_url and indexer_url in egov-config present under cluster-configs of the environment file. The same can be updated directly using the below command.
Restart all the pods which have a dependency on elasticsearchwith cluster-configs to pick a new elasticsearch_url.
Upgradation of Kafka Connect docker image to add additional connector
This page provides the steps to follow for upgrading Kafka Connect.
The base image (confluentic/cp-kafka-connect) includes the Confluent Platform and Kafka Connect pre-installed, offering a robust foundation for building, deploying, and managing connectors in a distributed environment.
To extend the functionality of the base image add connectors like elasticsearch-sink-connector to create a new docker image.
Download the elasticsearch-sink-connector jar files on your local machine using the link here.
Create a Dockerfile based on the below sample code.
Run the below command to build the docker image.
Run the below command to rename the docker image.
Push the image to the dockerhub using the below command.
Replace the image tag in kafka-connect helm chart values.yaml and redploy the kafka-connect.
This page provides comprehensive documentation and instructions for implementing a rolling upgrade strategy for your Elasticsearch cluster.
Note: During the rolling upgrade, it is anticipated that there will be some downtime. Additionally, ensure to take an elasticdump of the Elasticsearch data using the script provided below in the playground pod.
Copy the below script and save it as es-dump.sh. Replace the elasticsearch URL and the indices names in the script.
Run the below commands in the terminal.
Now, run the below command inside the playground pod.
List the elasticsearch pods and enter into any of the elasticsearch pod shells.
Disable shard allocation: You can avoid racing the clock by disabling the allocation of replicas before shutting down data nodes. Stop non-essential indexing and perform a synced flush: While you can continue indexing during the upgrade, shard recovery is much faster if you temporarily stop non-essential indexing and perform a synced-flush. Run the below curls inside elasticsearch data pod.
Scale down the replica count of elasticsearch master and data from 3 to 0.
Edit the Statefulset of elasticsearch master by replacing the docker image removing deprecated environment variables and adding compatible environment variables. Replace the elasticsearch image tag from 6.6.2 to 7.17.15. The below code provides the depraced environment variables and compatible environment variables.
Edit elasticsearch-master values.yaml file
Edit the Statefulset of elasticsearch data by replacing the docker image removing deprecated environment variables and adding compatible environment variables. Replace the elasticsearch image tag from 6.6.2 to 7.17.15.
Edit elasticsearch-data values.yaml file.
After making the changes, scale up the statefulsets of elasticsearch data and master.
After all pods are in running state, re-enable shard allocation and check cluster health.
You have successfully upgraded the elasticsearch cluster from v6.6.2 to v7.17.15 :)
ReIndexing the Indices:
After successfully upgrading the elasticsearch, reindex the indices present in elasticsearch using below script which are created in v6.6.2 or earlier.
Copy the below script and save it as es-reindex.sh. Replace the elasticsearch URL in the script.
Run the below commands in the terminal.
Now, run the below command inside the playground pod.
NOTE: Make Sure to delete jaeger indices as mapping is not supported in v8.11.3 and the indices which are created before v7.17.15 by reindexing. If the indices which are created in v6.6.2 or earlier are present then the upgradation from v7.17.15 to v8.11.3 may fail.
Scale down the replica count of elasticsearch master and data from 3 to 0.
Edit the Statefulset of elasticsearch master by replacing the docker image removing deprecated environment variables and adding compatible environment variables. Replace the elasticsearch image tag from 7.17.15 to 8.11.3. The below code provides the compatible environment variables and if you are following a rolling upgrade then there are no deprecated environment variables from v7.17.15 to v8.11.3.
Edit the Statefulset of elasticsearch data by replacing the docker image removing deprecated environment variables and adding compatible environment variables. Replace the elasticsearch image tag from 7.17.15 to 8.11.3.
After making the changes, scale up the statefulsets of elasticsearch data and master.
After all pods are in running state, re-enable shard allocation and check cluster health.
Curator is a tool from Elastic (the company behind Elasticsearch) to help manage your Elasticsearch cluster. You can create, backup, and delete some indices, Curator helps make this process automated and repeatable. Curator is written in Python, so almost all operating systems support it. It can easily manage the huge number of logs written to the Elasticsearch cluster periodically by deleting them and thus helps you save disk space.
es-curator helm chart for SSL-enabled elastic search: https://github.com/egovernments/DIGIT-DevOps/tree/digit-lts-go/deploy-as-code/helm/charts/backbone-services/es-curator
es-curator helm chart for SSL disabled elastic search: https://github.com/egovernments/DIGIT-DevOps/tree/unified-env/deploy-as-code/helm/charts/backbone-services/es-curator
A very elegant way to configure and automate Elasticsearch Curator execution is using a YAML configuration. The ‘es-curator-values.yaml’ file
You can modify the above es-curator-infra-values.yaml according to the requirements, some modifications are suggested below:
The above represents all the possible numbers for that position.
Schedule Cron Job: In the above code, at line number 6, the Cron Job is Scheduled to run at 6:45 PM every day. You can schedule your Cron Job accordingly.
RETAIN_LOGS_IN_DAYS: Specify the age of the logs to be deleted. In line 14 of the code, logs-to-retain-in-days indicate that logs older than 7 days will be deleted.
Terraform: Terraform is an open-source infrastructure as code software tool that enables you to safely and predictably create, change, and improve infrastructure.
what is Terraform is used for: Terraform is an IAC tool, used primarily by DevOps teams to automate various infrastructure tasks. The provisioning of cloud resources, for instance, is one of the main use cases of Terraform. It is a open-source provisioning tool written in the Go language and created by HashiCorp.
To install Terraform, use the following link to download the zip file.
As per our requirment we have to install a specific version which is 0.14.10.
Install the unzip.
Extract the downloaded file archive.
Move the executable into a directory searched for executables.
Run the below command to check whether the terraform is working.
kubectl is a CLI to connect to the kubernetes cluster from your machine
Install Visualstudio IDE Code for better code/configuration editing capabilities
Git
Cert-manager adds certificates and certificate issuers as a resource types in kubernetes cluster,and simplifies the process of obtaining, renewing and using those certificates. It will ensure certificates are valid and up-to-date, and attempt to renew certificates at a configured time before expiring.
SSL Certificate is a digital certificate that authenticates a website's identity and enables encrypted connection. SSL stands for Secure Sockets Layer, a security protocol that creates an encrypted link between a web server and a web browser. SSL cetificates keeps internet connections secure and prevents criminals from reading or modifying information transferred between two systems.
Cert-Manager can issue certificates from a variety of supported sources, including Let's Encrypt, HashiCorp Vault, and Venafi as well as private PKI.
In eGov Organization we are using letsencrypt-prod,letsencrypt-staging as a certificate-issuer.
First, we have to clone DIGIT-DevOps repo.
Check the cert-manager chart templates which contains yaml files of clusterissuer and clusterrole in the below link.
If we want to override any values in the chart. Open values.yaml and customize the chart.
Open egov-demo template in the Visual Studio code.
Check whether the below configurations is present in your environment file. If not add these configurations in your environment file.
Run the following command to deploy only the cert-manager.
After deploying check the certificate is issued or not using the below command.
The following output will be displayed.
Once the certificate is issued we can see it in secrets.
The following output will be displayed
To know about the cluster-issuers used in our deployement we can use the following command.
The following output will be displayed
Docker Hub: It is a service provided by Docker for finding and sharing container images with our team. Key features include: Private Repositories: Push and pull container images. Automated Builds: Automatically build container images from GitHub and Bitbucket and push them to Docker Hub.
Users get access to free public repositories for storing and sharing images or can choose a subscription plan for private repositories.
Docker Hub repositories allow you share container images with your team, customers, or the Docker community at large. Docker images are pushed to Docker Hub through the docker push command. A single Docker Hub repository can hold many Docker images.
Repositories: Push and Pull container images.
Teams and Organization: Manage access to private repositories of contanier images.
Docker Offical Images: Pull and use high-quality container images provided by Docker.
Docker Verified Publisher Images: Pull and use high-quality container images provided by extrernal vendors.
Builds: Automatically build container images from GitHub and push them to Docker Hub.
Webhooks: Trigger actions after a successful to repository to integrate Docker Hub with other services.
The following steps containes instructions on how to easily get Login to Docker Hub.
Follow the link below to create a Docker ID.
Sign in to https://hub.docker.com/
Click and create a Repository on the Docker Hub welcome page.
Name it in <Your-username>.
Set the visibility to private.
Click create.
You have created your first repository.
You will need to download Docker desktop to build, push and pull container images.
Download and install Docker desktop by following link given below
Sign in to the Docker desktop application using the Docker ID you have just created.
Run the following command to pull the image from Docker Hub.
Run the image locally.
Then the output will be similar to;
Start by creating a Dockerfile to specify your application.
Run the command to build your Docker image.
Run your Docker image locally.
Login in to a Docker registry.
Options:
--password , -p
password
--password-stdin
take the password from stdin
--username , -u
username
Push your Docker image Docker Hub.
Your repository in Docker Hub should now display new Latest tags under Tags.
Describes multi-tenancy setup for DIGIT
Options
Infra level separation vs logical separation
Recommendations
Multi-tenancy is the more common option for several reasons, but affordability tops the list:
Cost efficiency: Sharing of resources, databases, and the application itself means lower costs per customer. There is no need to buy or manage additional infrastructure or software. All the tenants share the server and storage space, which proves to be cheaper as it promotes economies of scale
Fast, easy deployment: With no new infrastructure to worry about, set-up and onboarding are simple. For instance carving out resources for a new team/project
Built-in security: Isolation between the tenants
Optimum performance: Multi-tenancies allow improve operational efficiency such as speed, utilisation, etc.
High scalability: Service small customers (whose size may not warrant dedicated infrastructure) and large organization's (that need access to unlimited computing resources).
Namespaces are the primary unit of tenancy in Kubernetes. By themselves, they don’t do much except organize other objects — but almost all policies support namespaces by default
Require cluster-level permissions to create
Included in Kubernetes natively
Official Kubernetes documentation on namespaces: https://kubernetes.io/docs/concepts/overview/working-with-objects/namespaces/
Kubernetes includes a built-in role-based access control mechanism that enables you to configure fine-grained and specific sets of permissions that define how a given Google Cloud user, or group of users, can interact with any Kubernetes object in your cluster, or in a specific Namespace of your cluster.
Kubernetes RBAC is enabled by default
Official Kubernetes documentation on RBAC: https://kubernetes.io/docs/reference/access-authn-authz/rbac/
Network policies allow you to limit connections between Pods. Therefore, using network policies provide better security by reducing the compromise radius.
Network Policies are an application-centric construct which allow you to specify how a pod is allowed to communicate with various network “entities”
Note that the network policies determine whether a connection is allowed, and they do not offer higher level features like authorization or secure transport (like SSL/TLS).
Control traffic flow at the IP address or port level (OSI layer 3 or 4)
Official Kubernetes documentation on Network Policies: https://kubernetes.io/docs/concepts/services-networking/network-policies/
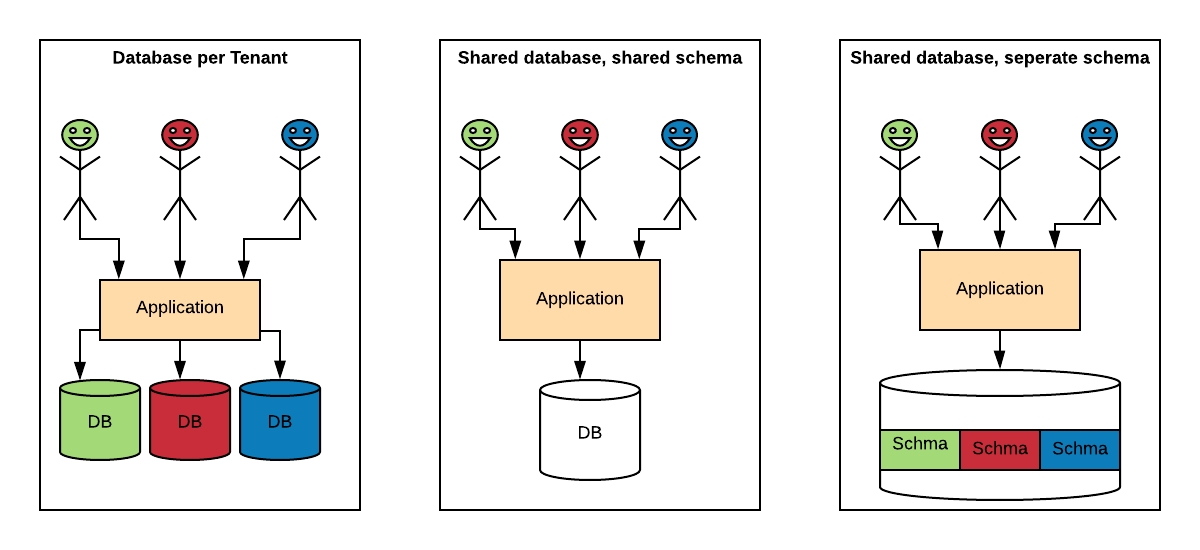
There are multiple well-known strategies to implement this architecture, ranging from highly isolated (like single-tenant) to everything shared. We can implement multi-tenancy using any of the following approaches:
Database per Tenant: Each Tenant has its own database and is isolated from other tenants.
Shared Database, Shared Schema: All Tenants share a database and tables. Every table has a Column with the Tenant Identifier, that shows the owner of the row.
Shared Database, Separate Schema: All Tenants share a database, but have their own database schemas and tables.
Multi-tenancy Models
logging solution in Kubernetes with ECK Operator
In this article, we’ll deploy ECK Operator using helm to the Kubernetes cluster and build a quick-ready solution for logging using Elasticsearch, Kibana, and Filebeat.
Built on the Kubernetes Operator pattern, Elastic Cloud on Kubernetes (ECK) extends the basic Kubernetes orchestration capabilities to support the setup and management of Elasticsearch, Kibana, APM Server, Enterprise Search, Beats, Elastic Agent, and Elastic Maps Server on Kubernetes.
With Elastic Cloud on Kubernetes, we can streamline critical operations, such as:
Managing and monitoring multiple clusters
Scaling cluster capacity and storage
Performing safe configuration changes through rolling upgrades
Securing clusters with TLS certificates
Setting up hot-warm-cold architectures with availability zone awareness
In this case we use helmfile to manage the helm deployments: helmfile.yaml
2. But we can do that just with helm: Installation using helm
After that we can see that the ECK pod is running:
The pod is up and running
There are a lot of different applications in Elastic Stack, such as:
Elasticsearch
Kibana
Beats (Filebeat/Metricbeat)
APM Server
Elastic Maps
etc
In our case, we’ll use only the first three of them, because we just want to deploy a classical EFK stack.
Let’s deploy the following in the order:
Elasticsearch cluster: This cluster has 3 nodes, each node with 100Gi of persistent storage, and intercommunication with a self-signed TLS-certificate.
2. The next one is Kibana: Very simple, just referencing Kibana object to Elasticsearch in a simple way.
3. The next one is Filebeat: This manifest contains DaemonSet used by Filebeat and some ServiceAccount stuff.
First of all, let’s get Kibana’s password: This password will be used to log in to Kibana
2. Running port-forward to Kibana service: Port 5601 is forwarded to localhost
3. Let’s log in to Kibana with the user elastic and password that we got before (http://localhost:5601), go to Analytics — Discover section and check logs:
This doc will cover how you can set up the tracing on existing environments either with help of go lang script or Jenkins deployment jobs.
The Jaeger tracing system is an open-source tracing system for microservices, and it supports the OpenTracing standard.
https://www.jaegertracing.io/docs OAuth2-Proxy Setup\
All DIGIT services are packaged using helm charts Installing Helm
kubectl is a CLI to connect to the kubernetes cluster from your machine
Install Visualstudio IDE Code for better code/configuration editing capabilities
Git
Agent – A network daemon that listens for spans sent over User Datagram Protocol.
Client – The component that implements the OpenTracing API for distributed tracing.
Collector – The component that receives spans and adds them into a queue to be processed.
Console – A UI that enables users to visualize their distributed tracing data.
Query – A service that fetches traces from storage.
Span – The logical unit of work in Jaeger, which includes the name, starting time and duration of the operation.
Trace – The way Jaeger presents execution requests. A trace is composed of at least one span.
Add below Jaeger configs in your env config file (eg. qa.yaml, dev.yaml and, etc…)
2. You can deploy the Jaeger using one of the below methods.
Deploy using go lang
go run main.go deploy -e <environment_name> -c 'jaeger'
Deploy using Jenkin’s respective deployment jobs
you can connect to the Jaeger console at https://<your_domin_name>/tracing/
Look at the box on the left-hand side of the page labelled Search. The first control, a chooser, lists the services available for tracing, click the chooser and you’ll see the listed services.
Select the service and click the Find Traces button at the bottom of the form. You can now compare the duration of traces through the graph shown above. You can also filter traces using “Tags” section under “Find Traces”. For example, Setting the “error=true” tag will filter out all the jobs that have errors.
To view the detailed trace, you can select a specific trace instance and check details like the time taken by each service, errors during execution and logs.
If due for some reason you are not able to access the tracing dashboard from your sub-domain, You can use the below command to access the tracing dashboard.
Note: port 8080 is for local access, if you are utilizing the 8080 port you can use the different port as well.
To access the tracing hit the browser with this localhost:8080 URL.
This doc covers the steps on how to deploy an OpenTelemetry collector on Kubernetes. We will then use an OTEL instrumented (Go) application provided by OpenTelemetry to send traces to the Collector. From there, we will bring the trace data to a Jaeger collector. Finally, the traces will be visualised using the Jaeger UI.
This image shows the flow between the application, OpenTelemetry collector and Jaeger.
This OpenTelemetry repository provides a complete demo on how you can deploy OpenTelemetry on Kubernetes, we can use this as a starting point.
To start off, we need a Kubernetes cluster you can use any of your existing Kubernetes clusters that has got the apx 2vCPUs, 4GB RAM, and 100GB Storage.
Skip this in case you have the existing cluster.
In case, you don't have the ready Kubernetes but you have a good local machine with at least 4GB RAM left, you can use a local instance of Kind. The application will access this Kubernetes cluster through a NodePort (on port 30080). So make sure this port is free.
To use NodePort with Kind, we need to first enable it.
Extra port mappings can be used to port forward to the kind nodes. This is a cross-platform option to get traffic into your kind cluster.
vim kind-config.yaml
Create the cluster with: kind create cluster --config kind-config.yaml
Once our Kubernetes cluster is up, we can start deploying Jaeger.
Jaeger is an open-source distributed tracing system for tracing transactions between distributed services. It’s used for monitoring and troubleshooting complex microservices environments. By doing this, we can view traces and analyse the application’s behaviour.
Using a tracing system (like Jaeger) is especially important in microservices environments since they are considered a lot more difficult to debug than a single monolithic application.
Distributed tracing monitoring
Performance and latency optimisation
Root cause analysis
Service dependency analysis
To deploy Jaeger on the Kubernetes cluster, we can make use of the Jaeger operator.
Operators are pieces of software that ease the operational complexity of running another piece of software.
You first install the Jaeger Operator on Kubernetes. This operator will then watch for new Jaeger custom resources (CR).
There are different ways of installing the Jaeger Operator on Kubernetes:
using Helm
using Deployment files
Before you start, pay attention to the Prerequisite section.
Since version 1.31 the Jaeger Operator uses webhooks to validate Jaeger custom resources (CRs). This requires an installed version of the cert-manager.
cert-manager is a powerful and extensible X.509 certificate controller for Kubernetes and OpenShift workloads. It will obtain certificates from a variety of Issuers, both popular public Issuers as well as private Issuers, and ensure the certificates are valid and up-to-date, and will attempt to renew certificates at a configured time before expiry.
Installation of cert-manager of is very simple, just run:
By default, cert-manager will be installed into the cert-manager namespace.
You can verify the installation by following the instructions here
With cert-manager installed, let’s continue with the deployment of Jaeger
Jump over to Artifact Hub and search for jaeger-operator
Add the Jaeger Tracing Helm repository:
helm repo add jaegertracing https://jaegertracing.github.io/helm-charts
To install the chart with the release name my-release (in the default namespace)
You can also install a specific version of the helm chart:
Verify that it’s installed on Kubernetes:
helm list -A
You can also deploy the Jaeger operator using deployment files.
kubectl create -f https://github.com/jaegertracing/jaeger-operator/releases/download/v1.36.0/jaeger-operator.yaml
At this point, there should be a jaeger-operator deployment available.
kubectl get deployment my-jaeger-operator
The operator is now ready to create Jaeger instances.
The operator that we just installed doesn’t do anything itself, it just means that we can create jaeger resources/instances that we want the jaeger operator to manage.
The simplest possible way to create a Jaeger instance is by deploying the All-in-one strategy, which installs the all-in-one image, and includes the agents, collector, query and the Jaeger UI in a single pod using in-memory storage.
Create a yaml file like the following. The name of the Jaeger instance will be simplest
vim simplest.yaml
kubectl apply -f simplest.yaml
After a little while, a new in-memory all-in-one instance of Jaeger will be available, suitable for quick demos and development purposes.
When the Jaeger instance is up and running, we can check the pods and services.
kubectl get pods
kubectl get services
To get the pod name, query for the pods belonging to the simplest Jaeger instance:
Query the logs from the pod:
kubectl logs -l app.kubernetes.io/instance=simplest
Use port-forwarding to access the Jaeger UI
kubectl port-forward svc/simplest-query 16686:16686
Jaeger UI
To deploy the OpenTelemetry collector, we will use this otel-collector.yaml file as a starting point. The yaml file consists of a ConfigMap, Service and a Deployment.
vim otel-collector.yaml
Make sure to change the name of the jaeger collector (exporter) to match the one we deployed above. In our case, that would be:
Also, pay attention to receivers. This part creates the receiver on the Collector side and opens up the port 4317 for receiving traces, which enables the application to send data to the OpenTelemetry Collector.
Apply the file with: kubectl apply -f otel-collector.yaml
Verify that the OpenTelemetry Collector is up and running.
kubectl get deployment
kubectl logs deployment/otel-collector
Time to send some trace data to our OpenTelemetry collector.
Remember, that the application access the Kubernetes cluster through a NodePort on port 30080. The Kubernetes service will bind the
4317port used to access the OTLP receiver to port30080on the Kubernetes node.By doing so, it makes it possible for us to access the Collector by using the static address
<node-ip>:30080. In case you are running a local cluster, this will belocalhost:30080. Source
This repository contains an (SDK) instrumented application written in Go, that simulates an application.
go run main.go
Let’s check out the telemetry data generated by our sample application
Again, we can use port-forwarding to access Jaeger UI.
Open the web-browser and go to http://127.0.0.1:16686/
Under Service select test-service to view the generated traces.
The service name is specified in the main.go file.
The application will access this Kubernetes cluster through a NodePort (on port 30080). The URL is specified here:
Done
This document has covered how we deploy an OpenTelemetry collector on Kubernetes. Then we sent trace data to this collector using an Otel SDK instrumented application written in Go. From there, the traces were sent to a Jaeger collector and visualised in Jaeger UI.
There are many monitoring tools out there. Before choosing what we would work with on our clients Clusters, we had to take many things into consideration. We use Prometheus and Grafana for Monitoring of our and our client’s clusters.
Monitoring is an important pillar of DevOps best practices. This gives you important information about the performance and status of your platform. This is even more true in distributed environments such as Kubernetes and microservices.
One of Kubernetes’ great strengths is its ability to extend its services and applications. When you reach thousands of applications, it’s impractical to manually monitor or use scripts. You need to adopt a scalable surveillance system! This is where Prometheus and Grafana come in.
Prometheus makes it possible to collect, store, and use platform metrics. Grafana, on the other hand, connects to Prometheus, allowing you to create beautiful dashboards and charts.
Today we’ll talk about what Prometheus is and the best way to deploy it to Kubernetes, with the operator. We will see how to set up a monitoring platform using Prometheus and Grafana.
This tutorial provides a good starting point for observability and goes a step further!
Prometheus is a free open source event monitoring and notification application developed on SoundCloud in 2012. Since then, many companies and organizations have adopted and contributed to them. In 2016, the Cloud Native Computing Foundation (CNCF) launched the Prometheus project shortly after Kubernetes
The timeline below shows the development of the Prometheus project.
Prometheus is considered Kubernetes’ default monitoring solution and was inspired by Google’s Borgman. Use HTTP pull requests to collect metrics from your application and infrastructure. It’s targets are discovered via service discovery or static configuration. Time series push is supported through the intermediate gateway.
Prometheus records real-time metrics in a time series database (TSDB). It provides a dimensional data model, ease of use, and scalable data collection. It also provides PromQL, a flexible query language to use this dimensionality.
The above architecture diagram shows that Prometheus is a multi-component monitoring system. The following parts are built into the Prometheus deployment:
The Prometheus server scrapes and stores time series data. It also provides a user interface for querying metrics.
The Client libraries are used for instrumenting application code.
Pushgateway supports collecting metrics from short-lived jobs.
Prometheus also has a service exporter for services that do not directly instrument metrics.
The Alertmanager takes care of real-time alerts based on triggers
Kubernetes provides many objects (pods, deploys, services, ingress, etc.) for deploying applications. Kubernetes allows you to create custom resources via custom resource definitions (CRDs).
The CRD object implements the final application behavior. This improves maintainability and reduces deployment effort. When using the Prometheus operator, each component of the architecture is taken from the CRD. This makes Prometheus setup easier than traditional installations.
Prometheus Classic installation requires a server configuration update to add new metric endpoints. This allows you to register a new endpoint as a target for collecting metrics. Prometheus operators use monitor objects (PodMonitor, ServiceMonitor) to dynamically discover endpoints and scrape metrics.
kube-prometheus-stack is a series of Kubernetes manifests, Grafana dashboards, and Prometheus rules. Make use of Prometheus using the operator to provide easy-to-use end-to-end monitoring of Kubernetes clusters.
This collection is available and can be deployed using a Helm Chart. You can deploy your monitor stack from a single command line-first time with Helm? Check out this article for a helm tutorial.
Not using Mac?
In Kubernetes, namespaces provide a mechanism for isolating groups of resources within a single cluster. We create a namespace named monitoring to prepare the new deployment:
Add the Prometheus chart repository and update the local cache:
Deploy the kube-stack-prometheus chart in the namespace monitoring with Helm:
hostRootFsMount.enabled is to be set to false to work on Docker Desktop on Macbook.
Now, CRDs are installed in the namespace. You can verify with the following kubectl command:
Here is what we have running now in the namespace:
The chart has installed Prometheus components and Operator, Grafana — and the following exporters:
prometheus-node-exporter exposes hardware and OS metrics
kube-state-metrics listens to the Kubernetes API server and generates metrics about the state of the objects
Our monitoring stack with Prometheus and Grafana is up and ready!
The Prometheus web UI is accessible through port-forward with this command:
Opening a browser tab on http://localhost:9090 shows the Prometheus web UI. We can retrieve the metrics collected from exporters:
Going to the “Status>Targets” and you can see all the metric endpoints discovered by the Prometheus server:
The credentials to connect to the Grafana web interface are stored in a Kubernetes Secret and encoded in base64. We retrieve the username/password couple with these two commands:
We create the port-forward to Grafana with the following command:
Open your browser and go to http://localhost:8080 and fill in previous credentials:
The kube-stack-prometheus deployment has provisioned Grafana dashboards:
Here we can see one of them showing compute resources of Kubernetes pods:
That’s all folks. Today, we looked at installing Grafana and Prometheus on our K8s Cluster.
Distributed Log Aggregation System: Loki is an open-source log aggregation system built for cloud-native environments, designed to efficiently collect, store, and query log data. Loki was inspired by Prometheus and shares similarities in its architecture and query language, making it a natural complement to Prometheus for comprehensive observability.
Label-based Indexing
LogQL Query Language
Log Stream Compression
Scalable and Cost-Efficient
Integration with Grafana
Configure the loki dashboard for easy access
This tutorial will walk you through How to Setup Logging in eGov
Know about fluent-bit Know about es-curator
DIGIT uses (required v1.13.3) automated scripts to deploy the builds onto Kubernetes - or or
All DIGIT services are packaged using helm charts
is a CLI to connect to the kubernetes cluster from your machine
IDE Code for better code/configuration editing capabilities
Git
git clone -b release https://github.com/egovernments/DIGIT-DevOps
Implement the kafka-v2-infra and elastic search infra setup into the existing cluster
Deploy the fluent-bit, kafka-connect-infra, and es-curator into your cluster, either using Jenkins deployment Jobs or go lang deployer
go run main.go deploy -e <environment_name> 'fluent-bit,kafka-connect-infra,es-curator'
Create Elasticsearch Service Sink Connector. You can run the below command in playground pods, make sure curl is installed before running any curl commands
Delete the Kafka infra sink connector if already exists with the Kafka connection, using the below command
Use the below command to check Kafka infra sink connector
curl http://kafka-connect-infra.kafka-cluster:8083/connectors/
To delete the connector
curl -X DELETE http://kafka-connect-infra.kafka-cluster:8083/connectors/egov-services-logs-to-es
The Kafka Connect Elasticsearch Service Sink connector moves data from Kafka-v2-infra to Elasticsearch infra. It writes data from a topic in Kafka-v2-infra to an index in Elasticsearch infra.
curl -X POST http://kafka-connect-infra.kafka-cluster:8083/connectors/ -H 'Content-Type: application/json' -H 'Cookie: SESSIONID=f1349448-761e-4ebc-a8bb-f6799e756185' -H 'Postman-Token: adabf0e8-0599-4ac9-a591-920586ff4d50' -H 'cache-control: no-cache' -d '{ "name": "egov-services-logs-to-es", "config": { "connector.class": "io.confluent.connect.elasticsearch.ElasticsearchSinkConnector", "connection.url": "http://elasticsearch-data-infra-v1.es-cluster-infra:9200", "type.name": "general", "topics": "egov-services-logs", "key.ignore": "true", "schema.ignore": true, "value.converter.schemas.enable": false, "key.converter": "org.apache.kafka.connect.storage.StringConverter", "value.converter": "org.apache.kafka.connect.json.JsonConverter", "transforms": "TopicNameRouter", "transforms.TopicNameRouter.type": "org.apache.kafka.connect.transforms.RegexRouter", "transforms.TopicNameRouter.regex": ".*", "transforms.TopicNameRouter.replacement": "egov-services-logs", "batch.size": 50, "max.buffered.records": 500, "flush.timeout.ms": 600000, "retry.backoff.ms": 5000, "read.timout.ms": 10000, "linger.ms": 100, "max.in.flight.requests": 2, "errors.log.enable": true, "errors.deadletterqueue.topic.name": "egov-services-logs-to-es-failed", "tasks.max": 1 } }'
You can verify sink Connector by using the below command
curl http://kafka-connect-infra.kafka-cluster:8083/connectors/
Deploy the kibana-infra to query the elasticseach infra egov-services-logs indexes data.
go run main.go deploy -e <environment_name> 'kibana-infra'
You can access the logging to https://<sub-domain_name>/kibana-infra
If the data is not receiving to elasticsearch infra's egov-services-logs index from kafka-v2-infra topic egov-services-logs.
Ensure that the elasticsearch sink connector is available, use the below command to check
curl http://kafka-connect-infra.kafka-cluster:8083/connectors/
Also, make sure kafka-connect-infra is running without errors
kubectl logs -f deployments/kafka-connect-infra -n kafka-cluster
Ensure elasticsearch infra is running without errors
In the event that none of the above services are having issues, take a look at the fluent-bit logs and restart it if necessary.
This doc will cover how you can set up the monitoring and alerting on existing k8s cluster either with help of go lang script or Jenkins deployment Jobs.
is an open-source system monitoring and alerting toolkit originally built at
DIGIT uses (required v1.13.3) automated scripts to deploy the builds onto Kubernetes - or or
All DIGIT services are packaged using helm charts
is a CLI to connect to the kubernetes cluster from your machine
IDE Code for better code/configuration editing capabilities
Git
The default installation is intended to suit monitoring a kubernetes cluster the chart is deployed onto. It closely matches the kube-prometheus project.
service monitors to scrape internal kubernetes components
kube-apiserver
kube-scheduler
kube-controller-manager
etcd
kube-dns/coredns
kube-proxy
With the installation, the chart also includes dashboards and alerts.
Deployment steps:
Chose your env config file, if you are deploying monitoring and alerting into the qa environment chose qa.yaml similarly for uat, dev, and other environments.
Depending upon your environment config file update the configs repo branch (like for qa.yaml add qa branch and uat.yaml it would be UAT the branch)
3. Enable the serviceMonitor in the nginx-ingress configs which are available in the same <env>.yaml and redeploy the nginx-ingress.
go run main.go deploy -e <environment_name> -c 'nginx-ingress'
4. To enable alerting, Add alertmanager secret in <env>-secrets.yaml
If you want you can change the slack channel and other details like group_wait, group_interval, and repeat_interval according to your values.
5. You can deploy the prometheus-operator using one of the below methods.
1. Deploy using go lang deployer
go run main.go deploy -e <environment_name> -c 'prometheus-operator,grafana,prometheus-kafka-exporter'
2. Deploy using Jenkin’s deployment job. (here we are using deploy-to-dev, you can choose your environment specific deployment job )
Login to the dashboard and click on add panel
Set all required queries and apply the changes. Export the JSON file by clicking on the save dashboard
3. Go to the configs repo and select your branch. In the branch look for the monitoring-dashboards folder and update the existing *-dashboard.json with a newly exported JSON file.
-> -> ->
-> (with dash between job and dsl; wait for the filter to become active and do not press enter, otherwise you will get an error message)
->
->
->
->
->
->
Scroll down to Maven ->
->
->
->
->
->
->
->
->
->
->
->
->
->
->
->
->
->
->
and verify that does not throw the Maven error anymore.
-> JobDSL ->
->
->
->
You have successfully upgraded the elasticsearch cluster from v7.17.15 to v8.11.3
All DIGIT services are packaged using helm charts Installing Helm
All content on this page by eGov Foundation is licensed under a Creative Commons Attribution 4.0 International License.
All content on this page by eGov Foundation is licensed under a Creative Commons Attribution 4.0 International License.
Clone the following repo (If not already done as part of Infra setup), you may need to and then run it to your machine.
chart includes multiple components and is suitable for a variety of use-cases.
Add the below grafana init container parameters to your
2. Add folder to the configs repo's branch which you selected in 1st step.
You can connect to the monitoring console at
Cloud Cost - Monitoring/Optimization/Publishing
Infra Utilization Summary
History of deployments
History of Config changes
History of release (if any) post-release findings if any.
Monthly summary update
Cleanup logs
Backup logs
Weekly DB dump in case of SDC
ES Data backup
Publish Weekly Summary report/Come up with the format
Publish JIRA status
Monitor the status of the environment and ensure every single service is running
Keep track of all tasks by creating tickets
Attend Daily scrums
Monitor the Prometheus Alters
This doc is about a Kafka troubleshooting guide
https://kafka.apache.org/intro https://zookeeper.apache.org/
kubectl is a CLI to connect to the kubernetes cluster from your machine
Install Visualstudio IDE Code for better code/configuration editing capabilities
Git
Using the below command you can able list down the Kafka brokers and their status
kubectl get pods -n kafka-cluster
If Kafka brokers are in crashloopbackoff or Error status
Describe the brokers and look for error
kubectl describe kafka-v2-0 -n kafka-cluster
kubectl describe kafka-v2-1 -n kafka-cluster
kubectl describe kafka-v2-2 -n kafka-cluster
Check Kafka broker's logs for error
kubectl logs -f kafka-v2-0 -n kafka-cluster
kubectl logs -f kafka-v2-1 -n kafka-cluster
kubectl logs -f kafka-v2-2 -n kafka-cluster
If brokers are in crashloopbackoff due to disk space issues, follow the below document for the cleanup of the logs
Ensure Zookeeper pods are running without any errors in order to run Kafka brokers without a hitch
If Zookeeper pods are in crashloopbackoff or Error status, Use the below commands to check the error
Describe the Zookeeper and look for error
kubectl describe zookeeper-v2-0 -n zookeeper-cluster
kubectl describe zookeeper-v2-1 -n zookeeper-cluster
kubectl describe zookeeper-v2-2 -n zookeeper-cluster
Check Kafka broker's logs for error
kubectl logs -f zookeeper-v2-0 -n zookeeper-cluster
kubectl logs -f zookeeper-v2-1 -n zookeeper-cluster
kubectl logs -f zookeeper-v2-2 -n zookeeper-cluster
How to monitor each and every service
How to debug
Potential fixes
In this tutorial, we will go through the step by step process to reset the offset of the Kafka consumer group
Consumer offset is used to track the messages that are consumed by consumers in a consumer group. A topic can be consumed by many consumer groups and each consumer group will have many consumers. A topic is divided into multiple partitions.
A consumer in a consumer group is assigned to a partition. Only one consumer is assigned to a partition. A consumer can be assigned to consume multiple partitions.
Consumer offset is managed at the partition level per consumer group.
Why reset the consumer offset?
In some scenarios, consumers which consumed the messages from a Kafka partition could have resulted in errors and the consumption would have been incomplete. In such cases of consumption failures you may have a need to re-consume the messages which were previously consumed. In such instances you would have to reset the consumer offset to an earlier offset.
Follow the steps below if consumers stop consuming data from consumer group topics for any reason.
Get a Shell to a Kafka broker
Find the current consumer offset
Use the kafka-consumer-groups along with the consumer group id followed by a describe.
You will see 2 entries related to offsets – CURRENT-OFFSET and LOG-END-OFFSET for the partitions in the topic for that consumer group. CURRENT-OFFSET is the current offset for the partition in the consumer group.
If you find out any topic lags that are not getting cleared then use the following steps to reset the consumer offset
Scale down the respective consumer group service (eg. for egov-infra-persist you have to scale down the egov-persister service )
Reset the consumer offset
Use the kafka-consumer-groups to change or reset the offset. You would have to specify the topic, consumer group and use the –reset-offsets flag to change the offset.
Reset offsets to offset from datetime. Format: ‘YYYY-MM-DDTHH:mm:SS.sss’
Scale up the respective consumer group service
The following steps illustrates the way to cleanup Kafka logs.
For any logs that appear to be overflowing and consuming disk space, you can use the following steps to clean up the logs from Kafka brokers
Note: Make sure the team is informed before doing this activity. This activity will delete the Kafka topic data
Backup list of log file names and their disk consumption data (optional)
kubectl exec -it kafka-v2-0 -- du -h /opt/kafka-data/logs |tee backup_0.logs
kubectl exec -it kafka-v2-1 -- du -h /opt/kafka-data/logs |tee backup_1.logs
kubectl exec -it kafka-v2-2 -- du -h /opt/kafka-data/logs |tee backup_2.logs
Cleanup the logs
kubectl exec -it kafka-v2-0 -- rm -rf /opt/kafka-data/logs/* -n kafka-cluster
kubectl exec -it kafka-v2-1 -- rm -rf /opt/kafka-data/logs/* -n kafka-cluster
kubectl exec -it kafka-v2-2 -- rm -rf /opt/kafka-data/logs/* -n kafka-cluster
3. If the pod is in crashlookbackoff state, and the storage is full, use the following workaround:
Make a copy of the pod manifest
kubectl get statefulsets kafka-v2 -n kafka-cluster -oyaml > manifest.yaml
Scale down the Kafka statefulset replica count to zero
kubectl scale statefulsets kafka-v2 -n kafka-cluster --replicas=0
Make the following changes to the copy of the statefulsets manifest file
Modify the command line from:
To
Apply this statefulsets manifest and scale up statefulsets replica count to 3, the pod should be in a running state now and follow [step 2].
Again scale down the Kafka statefulset replica count to zero
kubectl scale statefulsets kafka-v2 --replicas=0 -n kafka-cluster
Make the following changes to the copy of the statefulsets manifest file
Modify the command line from:
To
Apply this statefulsets manifest and scale up statefulsets replica count to 3
How to identify security issues - where to look
Troubleshooting
Solutions
AA
Here we are going to learn how to install helm and why we are helm in DIGIT-DevOps
Before installing Helm you need to know about Yaml files. Yaml file: Yaml files (Yet Another Markup Language) are used to transmit the data in web applications. Json file: Json files (JavaScript Object Notation) are a standard text-based format to view the structured data of javascript object syntax.
JSON and YAML files are both used to transfer data between web applications. The key difference is that YAML files use indentation similar to Python to indicate the level of your code, unlike JSON.
Git (please visit the GitOps page if you haven't installed Git).
Install Visual Studio https://code.visualstudio.com/download IDE Code for better code visualization/editing capabilities
Install Golang https://go.dev/doc/install#download(required version:V1.13.3)
Kubectl (see working with Kubernetes page to install kubectl)
What is helm? helm can be defined as a package manager for Kubernetes. It is used to deploy (to extend) the applications and services easily into the Kubernetes cluster in the form of Helm charts.
What are helm charts? It consists of a set of templates and a file containing variables used to fill these templates based on the custom values and configurations.
Why are we using helm in DIGIT?
Greatly improved productivity
Reduced complexity of deployments
More streamlined CI/CD pipeline
Helm charts are written in YAML and contain everything your developers need to deploy a container to a Kubernetes cluster. You may be used to creating Pods, Deployments, Services etc. in Kubernetes via the kubectl create command. This way of creating objects is indeed valid and great for learning purposes. However, when running Kubernetes in production you often want to have all your objects defined as .yaml files. This makes it easier for others to know what’s running in the cluster and allows for your deployments to be version-controlled.
https://www.npmjs.com/package/elasticdump https://www.elastic.co/guide/index.html
kubectl is a CLI to connect to the kubernetes cluster from your machine
Exec into the playground pod of you environment
kubectl exec -it<playground_pod_name> -n playground -- bash
Install elasticdump client if it's not available in the playground pod
The indexes available in an Elasticsearch environment can be known as follows
curl http://elasticsearch-data-v1.es-cluster:9200/_cat/indices?v
ES indexes can be dumped to a JSON file which can then be restored in the otherr environment.
elasticdump --input=http://elasticsearch-data-v1.es-cluster:9200/<my_index> --output=<my_index>.json
Note: Replace <my_index> with your index name that you need to take dump
Zip the dump and download the dump into your local machine
install the zip if it's not available in the playground pod
zip es-dump.zip <my_index>.json
Run the below command from your local machine to download the es dump
kubectl cp playground/<POD_NAME>:/root/es-dump.zip $HOME/es-dump.zip
The same can be restored in the other environment as follows
Copy the es dump from your local machine to another environment's playground pod
kubectl cp $HOME/es-dump.zip playground/<POD_NAME>:/root/es-dump.zip $HOME/es-dump.zip
Restore the es index dump
elasticdump --input= <my_index>.json --output=http://elasticsearch-data-v1.es-cluster:9200/<my_index>
Sometimes, the following error is thrown when indexes are getting restored.
error: {
type: 'cluster_block_exception',
reason: 'blocked by: [FORBIDDEN/12/index read-only / allow delete (api)];'
}
This occurs because in its default configuration, Elasticsearch will not allocate any more disk space when more than 90% of the disk is used overall. (i.e. by Elasticsearch or other applications). This watermark can be set lower but this may prevent important applications from being able to properly allocate disk space.
A way out is to increase the size of the destination ES cluster (according to the size of the source cluster).
The capacity of the ES cluster (for the source/destination end) can be checked as follows :
curl -XGET 'http://elasticsearch-data-v1.es-cluster:9200/_cat/allocation?v'
If, for example, the elasticsearch-data uses a PersistentVolumeClaim, the same can be edited to increase the size using edit pvc PVC name. This capacity can only be increased if the underlying storage class has AllowVolumeExpansion set to true.
\
We have to make sure t
It is basically a set of templates and a file containing variables used to fill these templates based on the custom values and configurations.
we can create helm charts on our own. For that we have to use the command helm create <chart name>. It will create a create a directory with files and some other directories. Those files are required to create helm chart.
We already discussed about how what is repository. Now we are going to create helm chart in DIGIT-DevOps repository which is one of the repository in eGovernments Foundation.
For that we need to clone that repository into local machine. Use the below commands to clone the repository in terminal or command prompt.
After cloning, go to helm directory and create helm chart there. cd command helps to change the directory
Finally helm creates a directory with the following layout
chart.yaml: This is where you'll put the information related to your chart. That includes the chart version, name, and description so you can find it if you publish it on an open repository.
values.yaml: Like we saw before, this is the file that contains defaults for variables.
Templates(dir): This is the place where we are storing manifest files. Everything here will be passed on and created in kubernetes.
charts: If your chart depends on another chart you own, or if you don't want to rely on Helm's default library (the default registry where Helm pull charts from), you can bring this same structure inside this directory.
Indexing issues can be identified by tallying the data in postgres database and in the ES. If there is a mismatch between the output there might be issues in indexing. To debug indexing issues, indexer service logs should be checked. The first step is to check if the record is getting consumed by the indexer service, if not the topic name in the indexer service should be checked. If the record is getting consumed then the logs should be checked. Errors might occur due to mismatching data types between the value in the record and in the index mapping(type of field defined in the mapping). Another source of error might be when indexer service calls other microservices like location. MDMS, HRMS etc. for enriching the data. Error might be thrown by these microservices which may result in data not getting indexed.
Reindexing is mostly done in two scenarios. The first is when the data is mismatching between RDBMS and the ES. In this case the data is reindexed into a new index and the old index is dropped. Using alias the new index is pointed to the same old index name. The second scenario is when the index structure needs to be changed. In this case the whole data needs to be reindexed using the new indexer configuration, once the reindexing is successful, the old index can be dropped and the new index can be pointed to the old index name using alias.
Payment data is generated by the collection service and stored in the PostgreSQL database. To reindex data from postgres database, the legacy index API should be called. Once this API is called indexer service will call the _plainsearch API of collection service in loop until it fetches all the records. The indexer service will transform and enrich each record and push it on a kafka topic: dss-collection-update (which is configurable in application.properties). From this kafka topic dss-ingest consumes the record and enriches it further. Once dss-ingest enriches the record it will push the record to either kafka topic or directly to ES based on a flag called es.push.direct
If this flag is set to true dss-ingest will push directly to the ES else it will push the data to kafka topic called: egov-dss-ingest-enriched. To put data from this topic to ES, a kafka connector should be created. Steps to create kafka connector are mentioned in following section and exact cURL can be found in reference documents
Suppose you had an index for property records by the name property-services. Upon triggering re-indexing, a new index was created by the name of property-services-enriched. You want to drop the original index and want all queries made to property-services index to internally refer to the newly created index. This is where the concept of aliasing comes into play. For creating an alias, the following curl needs to be executed -
For live indexing data, a configuration file should be created and added in configuration repo on GitHub. The path of the file should be added in the environment yaml file. The variable in which it has to be added is egov-indexer-yaml-repo-path. Once the configuration is added and the path is added in environment yaml, the indexer service should be restarted(redeployed) with config flag checked. This will restart the indexer service with the new configuration. Once the indexer is up and running, whenever a new event is generated by the service, the event will be consumed by the indexer service. The indexer service will transform and enrich the record based on the defined configuration. After that the indexer service will insert the data into ES.
Legacy index is the process of recreating the ES index from the postgres database. Indexer service does by fetching all the records from the particular service using a _plainsearch API. (The API url is part of request, but we generally expose an API called _plainsearch which is specifically used only for reindexing). The request body is as follows:
The requestInfo object is common for all requests. The apiDetails object contains the detail of the API which the indexer service will call to fetch the records. Following is a table describing the variables.
uri
URL of the search API
tenantIdForOpenSearch
TenantId for which the search should be called. (In case of statelevel tenantId like pb, the search API is expected to return data for all tenants)
offsetKey
Name of offset query param in search API
sizeKey
Name of limit query param in search API
maxPageSize
Batch size (The indexer will search for this many records in each search call)
responseJsonPath
JsonPath to service data (Basically it used to point to service data ignoring requestInfo)
legacyIndexTopic
Topic on which the data will be pushed
tenantId
TenantId of the index job (Unused field will be deprecated field in future releases)
After fetching the records in batches, the indexer service will transform and enrich each batch and push the batch of records on a topic given against the key legacyIndexTopic. To insert the data from this kafka topic, a kafka connector has to be created.
Kafka connector makes it easy to stream from numerous sources into Kafka and from Kafka into various sinks. Across DIGIT we use kafka connectors mainly for pushing data into the ElasticSearch sink.
For performance improvement in indexer service reindexing jobs, kafka-connect is getting used to do part of pushing records from kafka-topic to elastic search. The creation of reindexing jobs will be through indexer service only as earlier, but the portion where data is pushed to elastic search would be handled through kafka-connect and not through indexer as it was before. So for reindexing, kafka connect should be run after initiating a reindexing job through indexer service.
Following is the cURL for creating kafka connector with ElasticSearch as its sink -
This doc is about creating Jira ticket.
A ticket in Jira,is an event that must be investigated or a work item that must be addressed.In Jira Service Desk,tickets entered by a customers are called requests.Within a Jira Service Desk queue or in Jira Software, a request is called an issue.
Step 1: Open the Jira Software.
Step 2: Search for the respective Project in which you want to raise a ticket or the project which needs to address your ticket ,in the Search bar.
Step 3: Now click on the ' Create', a pop-up apears on the screen as shown below and fill the respective details.Once all the details are entered ,click on the create button below. Now the ticket is raised in the main page of the project you have chosen and will be addressed .
In this tutorial, we will go through the step by step process to deploy an NGINX ingress controller on a Kubernetes cluster.
The vast majority of Kubernetes clusters are used to host containers that process incoming requests from microservices to full web applications. Having these incoming requests come into a central location, then get handed out via services in Kubernetes, is the most secure way to configure a cluster. That central incoming point is an ingress controller.
NGINX is the most popularly used ingress controller for Kubernetes clusters. NGINX has most of the features enterprises are looking for, and will work as an ingress controller for Kubernetes regardless of which cloud, virtualization platform, or Linux operating system your Kubernetes cluster is running on.
\
is a CLI to connect to the kubernetes cluster from your machine
IDE Code for better code/configuration editing capabilities
All DIGIT services are packaged using helm charts
DIGIT uses (required v1.13.3) automated scripts to deploy the builds onto Kubernetes - or or
Git
A Kubernetes service account is required to run NGINX as a service within the cluster. The service account needs to have following roles:
A cluster role to allow it to get, list, and read the configuration of all services and events. This role could be limited if you were to have multiple ingress controllers installed within the cluster. But in most cases, limiting access for this service account may not be needed.
A namespace-specific role to read and update all the ConfigMaps and other items that are specific to the NGINX Ingress controller’s own configuration.
Clone the following repo (If not already done as part of Infra setup), you may need to and then run it to your machine.
The following configurations should be added to the environment file if they are not already there
\
In this tutorial, we will go through the step by step process to setup Deployment Job to the Jenkins
You may have doubts about what is deployment jobs? Below we explained about deployment jobs in detail.
Once we build a pipeline using jenkins we need to deploy(to set out) into a environment. For that we nee deployment jobs. Here, deployment jobs are nothing but the clusters(group of nodes or VM's)which are created using different environments. some of the environments that are present in DIGIT-DevOps:
In DIGIT there are so many deployment jobs are there. Go to the following repo to see all the deployment jobs.
Here you can see some of the deployment jobs that are present in DIGIT-DevOps.
Access control list (ACL) An access-control list is a list of permissions attached to an aws.
An ACL specifies which users or system processes can view, create, modify, delete, or otherwise manage objects.
Simply, ACL is a list of members in team and they can only able to access that job.
Repo: To which repository the deployment job be added.
Branch: Usually master branch.
Helm Directory: deploy-as-code/helm
Environment: Add job-name here.
refer this linkegovernments/DIGIT-DevOps/blob/master/deploy-as-code/helm/charts/backbone-services/jenkins/values.yam for moreinfo
This doc is about OAuth2-proxy Setup
Git
git clone -b release https://github.com/egovernments/DIGIT-DevOps
Add below configs into your environment file
Create a GitHub OAuth app and add the below secrets into the environment secrets file
GitHub OAuth App Creation
Homepage URL:- mentions your domain name eg. https://<your_domain_name>
Authorization callback URL:- https://<your_domain_name>/oauth2/callback
Deploy the oauth2-proxy via Jenkins deployment job or go land deployer
DIGIT uses (required v1.13.3) automated scripts to deploy the builds onto Kubernetes - or or
All DIGIT services are packaged using helm charts
is a CLI to connect to the Kubernetes cluster from your machine
IDE Code for better code/configuration editing capabilities
Clone the following repo (If not already done as part of Infra setup), you may need to and then run on your machine.
Follow the
