Loading...
Loading...
Loading...
Loading...
Loading...
Loading...
Loading...
Curator is a tool from Elastic (the company behind Elasticsearch) to help manage your Elasticsearch cluster. You can create, backup, and delete some indices, Curator helps make this process automated and repeatable. Curator is written in Python, so almost all operating systems support it. It can easily manage the huge number of logs written to the Elasticsearch cluster periodically by deleting them and thus helps you save disk space.
es-curator helm chart for SSL-enabled elastic search: https://github.com/egovernments/DIGIT-DevOps/tree/digit-lts-go/deploy-as-code/helm/charts/backbone-services/es-curator
es-curator helm chart for SSL disabled elastic search: https://github.com/egovernments/DIGIT-DevOps/tree/unified-env/deploy-as-code/helm/charts/backbone-services/es-curator
A very elegant way to configure and automate Elasticsearch Curator execution is using a YAML configuration. The ‘es-curator-values.yaml’ file
You can modify the above es-curator-infra-values.yaml according to the requirements, some modifications are suggested below:
The above represents all the possible numbers for that position.
Schedule Cron Job: In the above code, at line number 6, the Cron Job is Scheduled to run at 6:45 PM every day. You can schedule your Cron Job accordingly.
RETAIN_LOGS_IN_DAYS: Specify the age of the logs to be deleted. In line 14 of the code, logs-to-retain-in-days indicate that logs older than 7 days will be deleted.
This doc covers the steps on how to deploy an OpenTelemetry collector on Kubernetes. We will then use an OTEL instrumented (Go) application provided by OpenTelemetry to send traces to the Collector. From there, we will bring the trace data to a Jaeger collector. Finally, the traces will be visualised using the Jaeger UI.
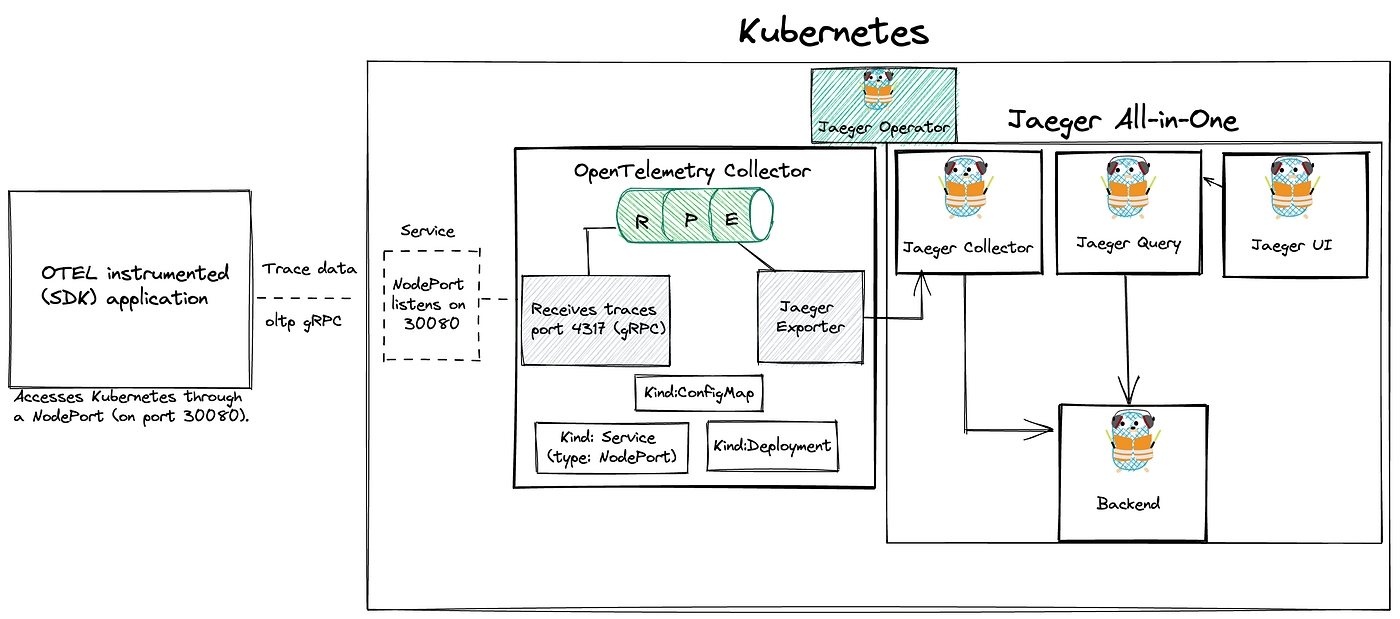
This image shows the flow between the application, OpenTelemetry collector and Jaeger.
This OpenTelemetry repository provides a complete demo on how you can deploy OpenTelemetry on Kubernetes, we can use this as a starting point.
To start off, we need a Kubernetes cluster you can use any of your existing Kubernetes clusters that has got the apx 2vCPUs, 4GB RAM, and 100GB Storage.
Skip this in case you have the existing cluster.
In case, you don't have the ready Kubernetes but you have a good local machine with at least 4GB RAM left, you can use a local instance of Kind. The application will access this Kubernetes cluster through a NodePort (on port 30080). So make sure this port is free.
To use NodePort with Kind, we need to first enable it.
Extra port mappings can be used to port forward to the kind nodes. This is a cross-platform option to get traffic into your kind cluster.
vim kind-config.yaml
Create the cluster with: kind create cluster --config kind-config.yaml
Once our Kubernetes cluster is up, we can start deploying Jaeger.
Jaeger is an open-source distributed tracing system for tracing transactions between distributed services. It’s used for monitoring and troubleshooting complex microservices environments. By doing this, we can view traces and analyse the application’s behaviour.
Using a tracing system (like Jaeger) is especially important in microservices environments since they are considered a lot more difficult to debug than a single monolithic application.
Distributed tracing monitoring
Performance and latency optimisation
Root cause analysis
Service dependency analysis
To deploy Jaeger on the Kubernetes cluster, we can make use of the Jaeger operator.
Operators are pieces of software that ease the operational complexity of running another piece of software.
You first install the Jaeger Operator on Kubernetes. This operator will then watch for new Jaeger custom resources (CR).
There are different ways of installing the Jaeger Operator on Kubernetes:
using Helm
using Deployment files
Before you start, pay attention to the Prerequisite section.
Since version 1.31 the Jaeger Operator uses webhooks to validate Jaeger custom resources (CRs). This requires an installed version of the cert-manager.
cert-manager is a powerful and extensible X.509 certificate controller for Kubernetes and OpenShift workloads. It will obtain certificates from a variety of Issuers, both popular public Issuers as well as private Issuers, and ensure the certificates are valid and up-to-date, and will attempt to renew certificates at a configured time before expiry.
Installation of cert-manager of is very simple, just run:
By default, cert-manager will be installed into the cert-manager namespace.
You can verify the installation by following the instructions here
With cert-manager installed, let’s continue with the deployment of Jaeger
Jump over to Artifact Hub and search for jaeger-operator
Add the Jaeger Tracing Helm repository:
helm repo add jaegertracing https://jaegertracing.github.io/helm-charts
To install the chart with the release name my-release (in the default namespace)
You can also install a specific version of the helm chart:
Verify that it’s installed on Kubernetes:
helm list -A
You can also deploy the Jaeger operator using deployment files.
kubectl create -f https://github.com/jaegertracing/jaeger-operator/releases/download/v1.36.0/jaeger-operator.yaml
At this point, there should be a jaeger-operator deployment available.
kubectl get deployment my-jaeger-operator
The operator is now ready to create Jaeger instances.
The operator that we just installed doesn’t do anything itself, it just means that we can create jaeger resources/instances that we want the jaeger operator to manage.
The simplest possible way to create a Jaeger instance is by deploying the All-in-one strategy, which installs the all-in-one image, and includes the agents, collector, query and the Jaeger UI in a single pod using in-memory storage.
Create a yaml file like the following. The name of the Jaeger instance will be simplest
vim simplest.yaml
kubectl apply -f simplest.yaml
After a little while, a new in-memory all-in-one instance of Jaeger will be available, suitable for quick demos and development purposes.
When the Jaeger instance is up and running, we can check the pods and services.
kubectl get pods
kubectl get services
To get the pod name, query for the pods belonging to the simplest Jaeger instance:
Query the logs from the pod:
kubectl logs -l app.kubernetes.io/instance=simplest
Use port-forwarding to access the Jaeger UI
kubectl port-forward svc/simplest-query 16686:16686
Jaeger UI
To deploy the OpenTelemetry collector, we will use this otel-collector.yaml file as a starting point. The yaml file consists of a ConfigMap, Service and a Deployment.
vim otel-collector.yaml
Make sure to change the name of the jaeger collector (exporter) to match the one we deployed above. In our case, that would be:
Also, pay attention to receivers. This part creates the receiver on the Collector side and opens up the port 4317 for receiving traces, which enables the application to send data to the OpenTelemetry Collector.
Apply the file with: kubectl apply -f otel-collector.yaml
Verify that the OpenTelemetry Collector is up and running.
kubectl get deployment
kubectl logs deployment/otel-collector
Time to send some trace data to our OpenTelemetry collector.
Remember, that the application access the Kubernetes cluster through a NodePort on port 30080. The Kubernetes service will bind the
4317port used to access the OTLP receiver to port30080on the Kubernetes node.By doing so, it makes it possible for us to access the Collector by using the static address
<node-ip>:30080. In case you are running a local cluster, this will belocalhost:30080. Source
This repository contains an (SDK) instrumented application written in Go, that simulates an application.
go run main.go
Let’s check out the telemetry data generated by our sample application
Again, we can use port-forwarding to access Jaeger UI.
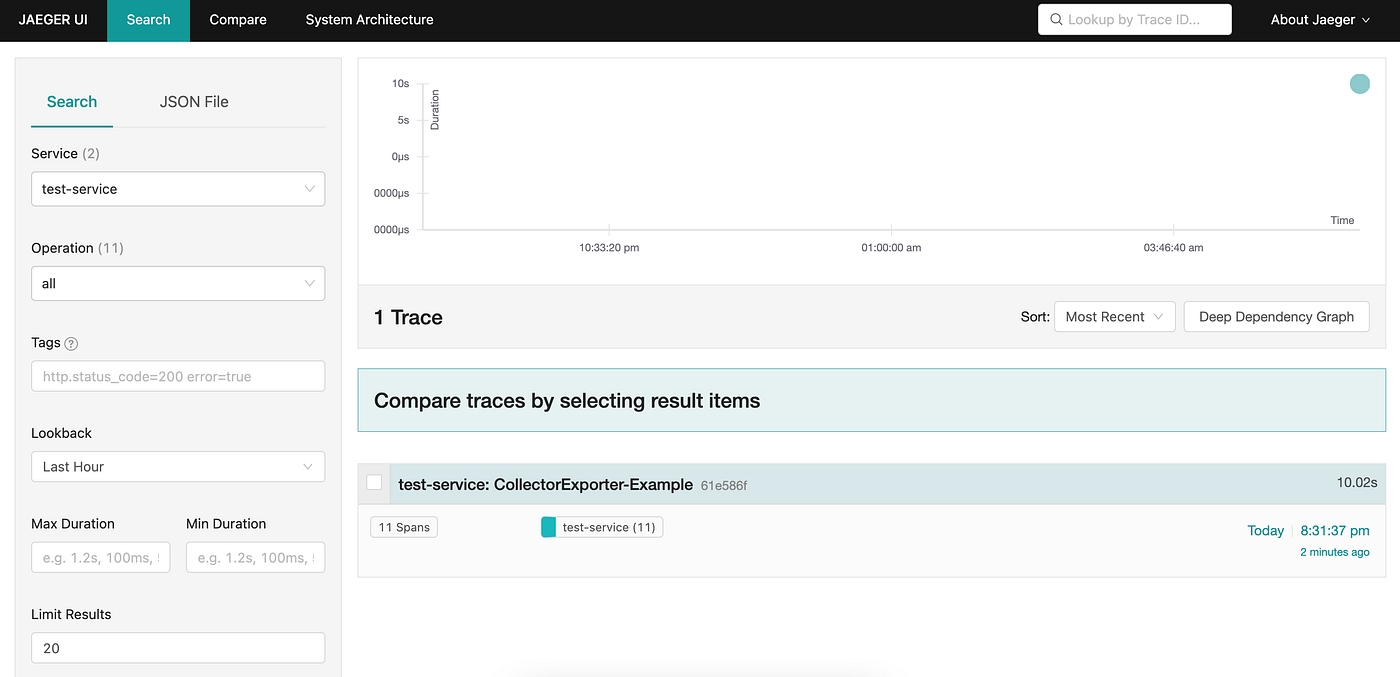
Open the web-browser and go to http://127.0.0.1:16686/
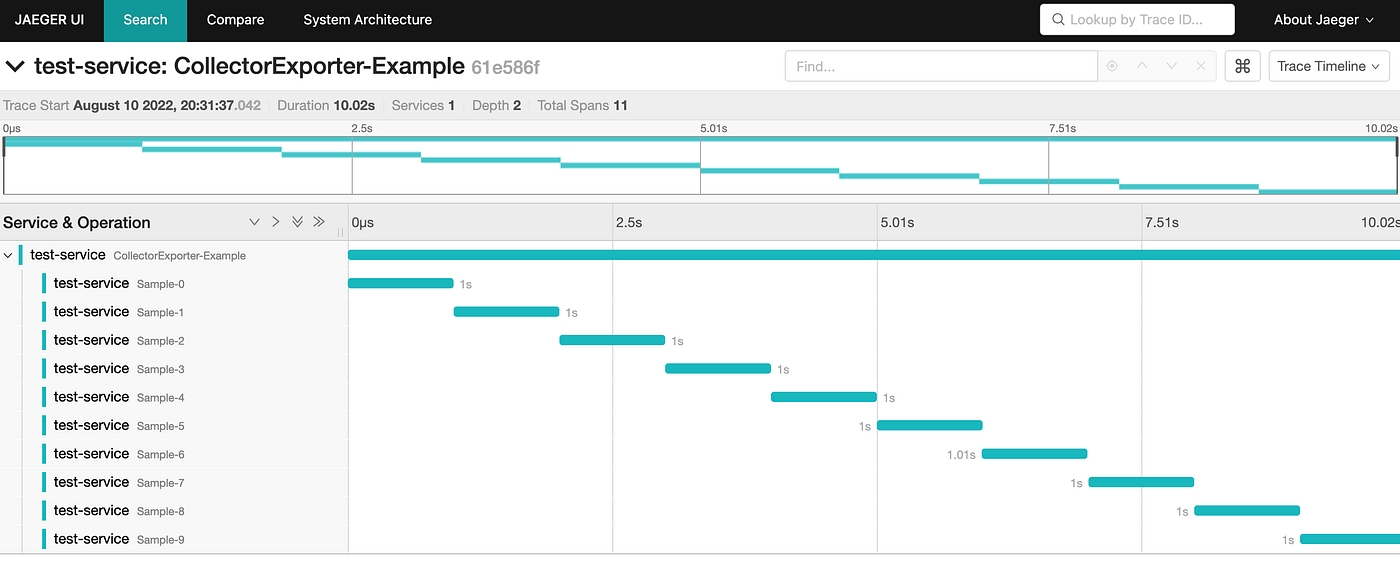
Under Service select test-service to view the generated traces.
The service name is specified in the main.go file.
The application will access this Kubernetes cluster through a NodePort (on port 30080). The URL is specified here:
Done
This document has covered how we deploy an OpenTelemetry collector on Kubernetes. Then we sent trace data to this collector using an Otel SDK instrumented application written in Go. From there, the traces were sent to a Jaeger collector and visualised in Jaeger UI.
There are many monitoring tools out there. Before choosing what we would work with on our clients Clusters, we had to take many things into consideration. We use Prometheus and Grafana for Monitoring of our and our client’s clusters.
Monitoring is an important pillar of DevOps best practices. This gives you important information about the performance and status of your platform. This is even more true in distributed environments such as Kubernetes and microservices.
One of Kubernetes’ great strengths is its ability to extend its services and applications. When you reach thousands of applications, it’s impractical to manually monitor or use scripts. You need to adopt a scalable surveillance system! This is where Prometheus and Grafana come in.
Prometheus makes it possible to collect, store, and use platform metrics. Grafana, on the other hand, connects to Prometheus, allowing you to create beautiful dashboards and charts.
Today we’ll talk about what Prometheus is and the best way to deploy it to Kubernetes, with the operator. We will see how to set up a monitoring platform using Prometheus and Grafana.
This tutorial provides a good starting point for observability and goes a step further!
Prometheus is a free open source event monitoring and notification application developed on SoundCloud in 2012. Since then, many companies and organizations have adopted and contributed to them. In 2016, the Cloud Native Computing Foundation (CNCF) launched the Prometheus project shortly after Kubernetes
The timeline below shows the development of the Prometheus project.
Prometheus is considered Kubernetes’ default monitoring solution and was inspired by Google’s Borgman. Use HTTP pull requests to collect metrics from your application and infrastructure. It’s targets are discovered via service discovery or static configuration. Time series push is supported through the intermediate gateway.
Prometheus records real-time metrics in a time series database (TSDB). It provides a dimensional data model, ease of use, and scalable data collection. It also provides PromQL, a flexible query language to use this dimensionality.
The above architecture diagram shows that Prometheus is a multi-component monitoring system. The following parts are built into the Prometheus deployment:
The Prometheus server scrapes and stores time series data. It also provides a user interface for querying metrics.
The Client libraries are used for instrumenting application code.
Pushgateway supports collecting metrics from short-lived jobs.
Prometheus also has a service exporter for services that do not directly instrument metrics.
The Alertmanager takes care of real-time alerts based on triggers
Kubernetes provides many objects (pods, deploys, services, ingress, etc.) for deploying applications. Kubernetes allows you to create custom resources via custom resource definitions (CRDs).
The CRD object implements the final application behavior. This improves maintainability and reduces deployment effort. When using the Prometheus operator, each component of the architecture is taken from the CRD. This makes Prometheus setup easier than traditional installations.
Prometheus Classic installation requires a server configuration update to add new metric endpoints. This allows you to register a new endpoint as a target for collecting metrics. Prometheus operators use monitor objects (PodMonitor, ServiceMonitor) to dynamically discover endpoints and scrape metrics.
kube-prometheus-stack is a series of Kubernetes manifests, Grafana dashboards, and Prometheus rules. Make use of Prometheus using the operator to provide easy-to-use end-to-end monitoring of Kubernetes clusters.
This collection is available and can be deployed using a Helm Chart. You can deploy your monitor stack from a single command line-first time with Helm? Check out this article for a helm tutorial.
Not using Mac?
In Kubernetes, namespaces provide a mechanism for isolating groups of resources within a single cluster. We create a namespace named monitoring to prepare the new deployment:
Add the Prometheus chart repository and update the local cache:
Deploy the kube-stack-prometheus chart in the namespace monitoring with Helm:
hostRootFsMount.enabled is to be set to false to work on Docker Desktop on Macbook.
Now, CRDs are installed in the namespace. You can verify with the following kubectl command:
Here is what we have running now in the namespace:
The chart has installed Prometheus components and Operator, Grafana — and the following exporters:
prometheus-node-exporter exposes hardware and OS metrics
kube-state-metrics listens to the Kubernetes API server and generates metrics about the state of the objects
Our monitoring stack with Prometheus and Grafana is up and ready!
The Prometheus web UI is accessible through port-forward with this command:
Opening a browser tab on http://localhost:9090 shows the Prometheus web UI. We can retrieve the metrics collected from exporters:
Going to the “Status>Targets” and you can see all the metric endpoints discovered by the Prometheus server:
The credentials to connect to the Grafana web interface are stored in a Kubernetes Secret and encoded in base64. We retrieve the username/password couple with these two commands:
We create the port-forward to Grafana with the following command:
Open your browser and go to http://localhost:8080 and fill in previous credentials:
The kube-stack-prometheus deployment has provisioned Grafana dashboards:
Here we can see one of them showing compute resources of Kubernetes pods:
That’s all folks. Today, we looked at installing Grafana and Prometheus on our K8s Cluster.
Distributed Log Aggregation System: Loki is an open-source log aggregation system built for cloud-native environments, designed to efficiently collect, store, and query log data. Loki was inspired by Prometheus and shares similarities in its architecture and query language, making it a natural complement to Prometheus for comprehensive observability.
Label-based Indexing
LogQL Query Language
Log Stream Compression
Scalable and Cost-Efficient
Integration with Grafana
Configure the loki dashboard for easy access
This doc will cover how you can set up the tracing on existing environments either with help of go lang script or Jenkins deployment jobs.
The Jaeger tracing system is an open-source tracing system for microservices, and it supports the OpenTracing standard.
https://www.jaegertracing.io/docs OAuth2-Proxy Setup\
All DIGIT services are packaged using helm charts Installing Helm
kubectl is a CLI to connect to the kubernetes cluster from your machine
Install Visualstudio IDE Code for better code/configuration editing capabilities
Git
Agent – A network daemon that listens for spans sent over User Datagram Protocol.
Client – The component that implements the OpenTracing API for distributed tracing.
Collector – The component that receives spans and adds them into a queue to be processed.
Console – A UI that enables users to visualize their distributed tracing data.
Query – A service that fetches traces from storage.
Span – The logical unit of work in Jaeger, which includes the name, starting time and duration of the operation.
Trace – The way Jaeger presents execution requests. A trace is composed of at least one span.
Add below Jaeger configs in your env config file (eg. qa.yaml, dev.yaml and, etc…)
2. You can deploy the Jaeger using one of the below methods.
Deploy using go lang
go run main.go deploy -e <environment_name> -c 'jaeger'
Deploy using Jenkin’s respective deployment jobs
you can connect to the Jaeger console at https://<your_domin_name>/tracing/
Look at the box on the left-hand side of the page labelled Search. The first control, a chooser, lists the services available for tracing, click the chooser and you’ll see the listed services.
Select the service and click the Find Traces button at the bottom of the form. You can now compare the duration of traces through the graph shown above. You can also filter traces using “Tags” section under “Find Traces”. For example, Setting the “error=true” tag will filter out all the jobs that have errors.
To view the detailed trace, you can select a specific trace instance and check details like the time taken by each service, errors during execution and logs.
If due for some reason you are not able to access the tracing dashboard from your sub-domain, You can use the below command to access the tracing dashboard.
Note: port 8080 is for local access, if you are utilizing the 8080 port you can use the different port as well.
To access the tracing hit the browser with this localhost:8080 URL.
This doc will cover how you can set up the monitoring and alerting on existing k8s cluster either with help of go lang script or Jenkins deployment Jobs.
is an open-source system monitoring and alerting toolkit originally built at
DIGIT uses (required v1.13.3) automated scripts to deploy the builds onto Kubernetes - or or
All DIGIT services are packaged using helm charts
is a CLI to connect to the kubernetes cluster from your machine
IDE Code for better code/configuration editing capabilities
Git
The default installation is intended to suit monitoring a kubernetes cluster the chart is deployed onto. It closely matches the kube-prometheus project.
service monitors to scrape internal kubernetes components
kube-apiserver
kube-scheduler
kube-controller-manager
etcd
kube-dns/coredns
kube-proxy
With the installation, the chart also includes dashboards and alerts.
Deployment steps:
Chose your env config file, if you are deploying monitoring and alerting into the qa environment chose qa.yaml similarly for uat, dev, and other environments.
Depending upon your environment config file update the configs repo branch (like for qa.yaml add qa branch and uat.yaml it would be UAT the branch)
3. Enable the serviceMonitor in the nginx-ingress configs which are available in the same <env>.yaml and redeploy the nginx-ingress.
go run main.go deploy -e <environment_name> -c 'nginx-ingress'
4. To enable alerting, Add alertmanager secret in <env>-secrets.yaml
If you want you can change the slack channel and other details like group_wait, group_interval, and repeat_interval according to your values.
5. You can deploy the prometheus-operator using one of the below methods.
1. Deploy using go lang deployer
go run main.go deploy -e <environment_name> -c 'prometheus-operator,grafana,prometheus-kafka-exporter'
2. Deploy using Jenkin’s deployment job. (here we are using deploy-to-dev, you can choose your environment specific deployment job )
Login to the dashboard and click on add panel
Set all required queries and apply the changes. Export the JSON file by clicking on the save dashboard
3. Go to the configs repo and select your branch. In the branch look for the monitoring-dashboards folder and update the existing *-dashboard.json with a newly exported JSON file.
This tutorial will walk you through How to Setup Logging in eGov
Know about fluent-bit Know about es-curator
DIGIT uses (required v1.13.3) automated scripts to deploy the builds onto Kubernetes - or or
All DIGIT services are packaged using helm charts
is a CLI to connect to the kubernetes cluster from your machine
IDE Code for better code/configuration editing capabilities
Git
git clone -b release https://github.com/egovernments/DIGIT-DevOps
Implement the kafka-v2-infra and elastic search infra setup into the existing cluster
Deploy the fluent-bit, kafka-connect-infra, and es-curator into your cluster, either using Jenkins deployment Jobs or go lang deployer
go run main.go deploy -e <environment_name> 'fluent-bit,kafka-connect-infra,es-curator'
Create Elasticsearch Service Sink Connector. You can run the below command in playground pods, make sure curl is installed before running any curl commands
Delete the Kafka infra sink connector if already exists with the Kafka connection, using the below command
Use the below command to check Kafka infra sink connector
curl http://kafka-connect-infra.kafka-cluster:8083/connectors/
To delete the connector
curl -X DELETE http://kafka-connect-infra.kafka-cluster:8083/connectors/egov-services-logs-to-es
The Kafka Connect Elasticsearch Service Sink connector moves data from Kafka-v2-infra to Elasticsearch infra. It writes data from a topic in Kafka-v2-infra to an index in Elasticsearch infra.
curl -X POST http://kafka-connect-infra.kafka-cluster:8083/connectors/ -H 'Content-Type: application/json' -H 'Cookie: SESSIONID=f1349448-761e-4ebc-a8bb-f6799e756185' -H 'Postman-Token: adabf0e8-0599-4ac9-a591-920586ff4d50' -H 'cache-control: no-cache' -d '{ "name": "egov-services-logs-to-es", "config": { "connector.class": "io.confluent.connect.elasticsearch.ElasticsearchSinkConnector", "connection.url": "http://elasticsearch-data-infra-v1.es-cluster-infra:9200", "type.name": "general", "topics": "egov-services-logs", "key.ignore": "true", "schema.ignore": true, "value.converter.schemas.enable": false, "key.converter": "org.apache.kafka.connect.storage.StringConverter", "value.converter": "org.apache.kafka.connect.json.JsonConverter", "transforms": "TopicNameRouter", "transforms.TopicNameRouter.type": "org.apache.kafka.connect.transforms.RegexRouter", "transforms.TopicNameRouter.regex": ".*", "transforms.TopicNameRouter.replacement": "egov-services-logs", "batch.size": 50, "max.buffered.records": 500, "flush.timeout.ms": 600000, "retry.backoff.ms": 5000, "read.timout.ms": 10000, "linger.ms": 100, "max.in.flight.requests": 2, "errors.log.enable": true, "errors.deadletterqueue.topic.name": "egov-services-logs-to-es-failed", "tasks.max": 1 } }'
You can verify sink Connector by using the below command
curl http://kafka-connect-infra.kafka-cluster:8083/connectors/
Deploy the kibana-infra to query the elasticseach infra egov-services-logs indexes data.
go run main.go deploy -e <environment_name> 'kibana-infra'
You can access the logging to https://<sub-domain_name>/kibana-infra
If the data is not receiving to elasticsearch infra's egov-services-logs index from kafka-v2-infra topic egov-services-logs.
Ensure that the elasticsearch sink connector is available, use the below command to check
curl http://kafka-connect-infra.kafka-cluster:8083/connectors/
Also, make sure kafka-connect-infra is running without errors
kubectl logs -f deployments/kafka-connect-infra -n kafka-cluster
Ensure elasticsearch infra is running without errors
In the event that none of the above services are having issues, take a look at the fluent-bit logs and restart it if necessary.
logging solution in Kubernetes with ECK Operator
In this article, we’ll deploy ECK Operator using helm to the Kubernetes cluster and build a quick-ready solution for logging using Elasticsearch, Kibana, and Filebeat.
With Elastic Cloud on Kubernetes, we can streamline critical operations, such as:
Managing and monitoring multiple clusters
Scaling cluster capacity and storage
Performing safe configuration changes through rolling upgrades
Securing clusters with TLS certificates
Setting up hot-warm-cold architectures with availability zone awareness
After that we can see that the ECK pod is running:
The pod is up and running
Elasticsearch
Kibana
Beats (Filebeat/Metricbeat)
APM Server
Elastic Maps
etc
In our case, we’ll use only the first three of them, because we just want to deploy a classical EFK stack.
Let’s deploy the following in the order:
Elasticsearch cluster: This cluster has 3 nodes, each node with 100Gi of persistent storage, and intercommunication with a self-signed TLS-certificate.
2. The next one is Kibana: Very simple, just referencing Kibana object to Elasticsearch in a simple way.
3. The next one is Filebeat: This manifest contains DaemonSet used by Filebeat and some ServiceAccount stuff.
First of all, let’s get Kibana’s password: This password will be used to log in to Kibana
2. Running port-forward to Kibana service: Port 5601 is forwarded to localhost
All content on this page by eGov Foundation is licensed under a Creative Commons Attribution 4.0 International License.
All content on this page by eGov Foundation is licensed under a Creative Commons Attribution 4.0 International License.
chart includes multiple components and is suitable for a variety of use-cases.
Add the below grafana init container parameters to your
2. Add folder to the configs repo's branch which you selected in 1st step.
You can connect to the monitoring console at
Clone the following repo (If not already done as part of Infra setup), you may need to and then run it to your machine.
Built on the Kubernetes Operator pattern, extends the basic Kubernetes orchestration capabilities to support the setup and management of Elasticsearch, Kibana, APM Server, Enterprise Search, Beats, Elastic Agent, and Elastic Maps Server on Kubernetes.
In this case we use to manage the helm deployments: helmfile.yaml
2. But we can do that just with : Installation using helm
There are a lot of in Elastic Stack, such as:
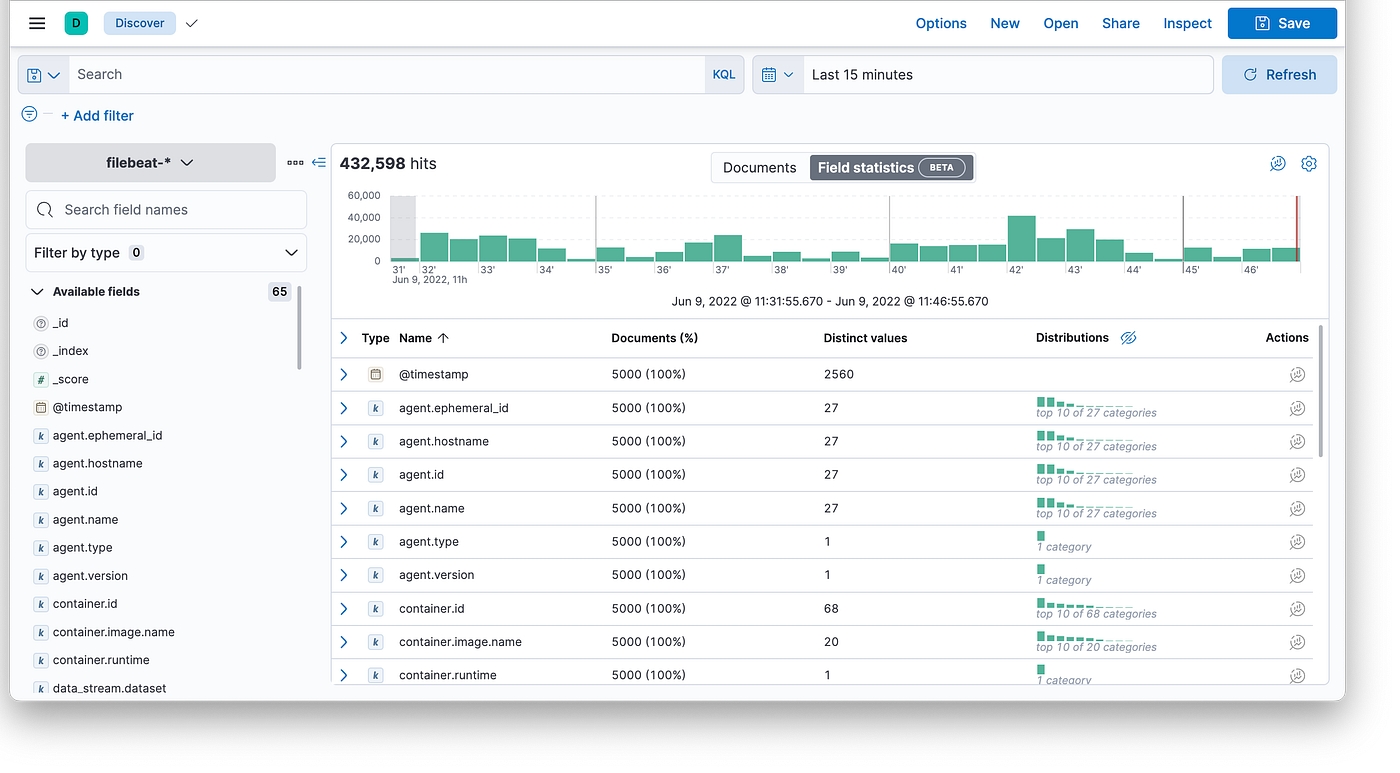
3. Let’s log in to Kibana with the user elastic and password that we got before (), go to Analytics — Discover section and check logs:

