> For the complete documentation index, see [llms.txt](https://docs.digit.org/llms.txt). Markdown versions of documentation pages are available by appending `.md` to page URLs; this page is available as [Markdown](https://docs.digit.org/health/v2.1/deploy/installation/setup-kibana-dashboard/create-or-edit-existing-dashboards.md).
# Create or Edit Existing Dashboards
How to create or edit HCM product dashboards in Kibana
## Steps
{% stepper %}
{% step %}
### Create dashboards
* To understand how to create dashboards in Kibana, refer to this guide:[ Create a Dashboard of Panels](https://www.elastic.co/guide/en/kibana/current/create-a-dashboard-of-panels-with-web-server-data.html).
{% endstep %}
{% step %}
### Edit existing dashboards
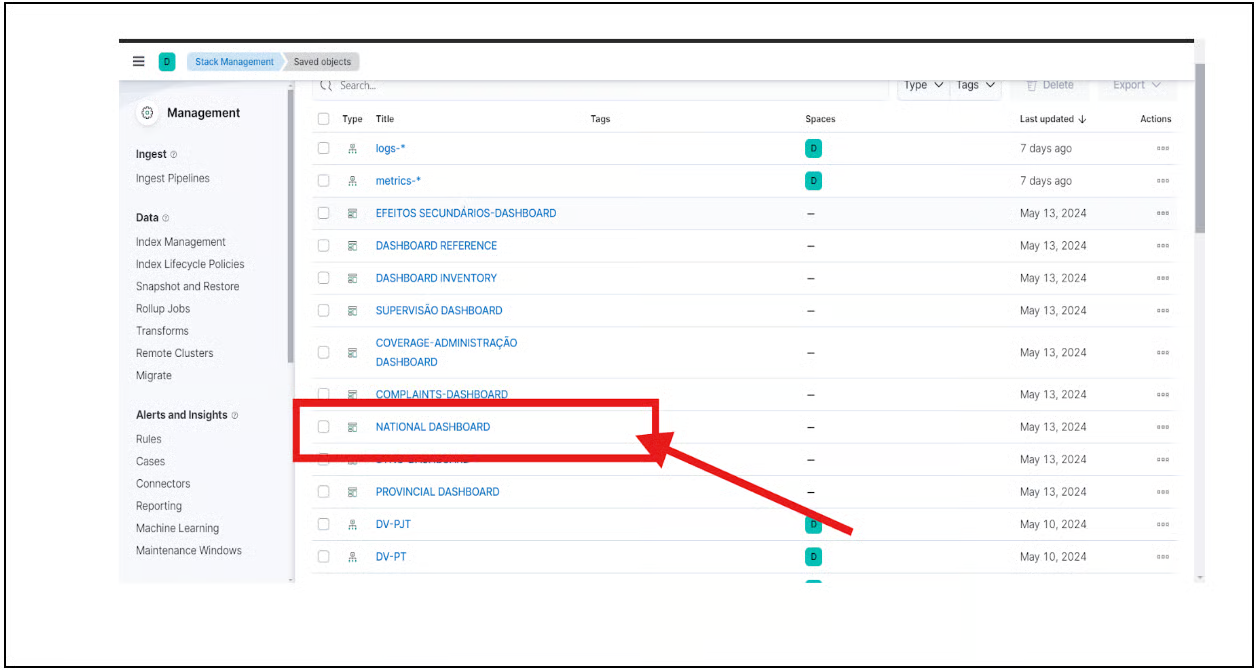
* Open the desired dashboard.
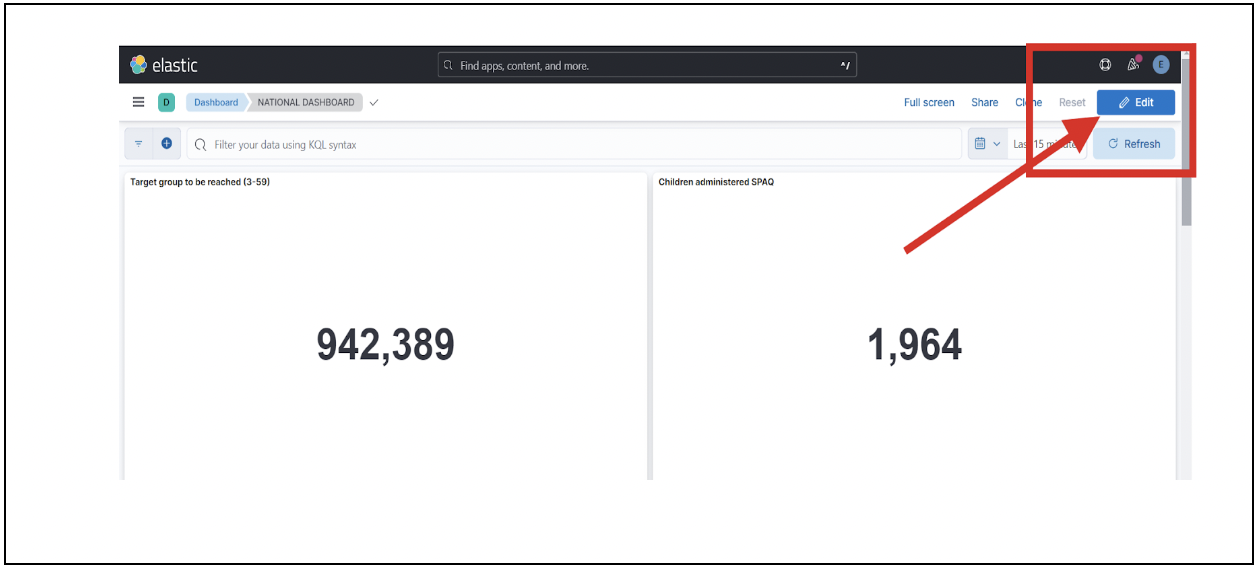
* Click on the 'Edit' button.
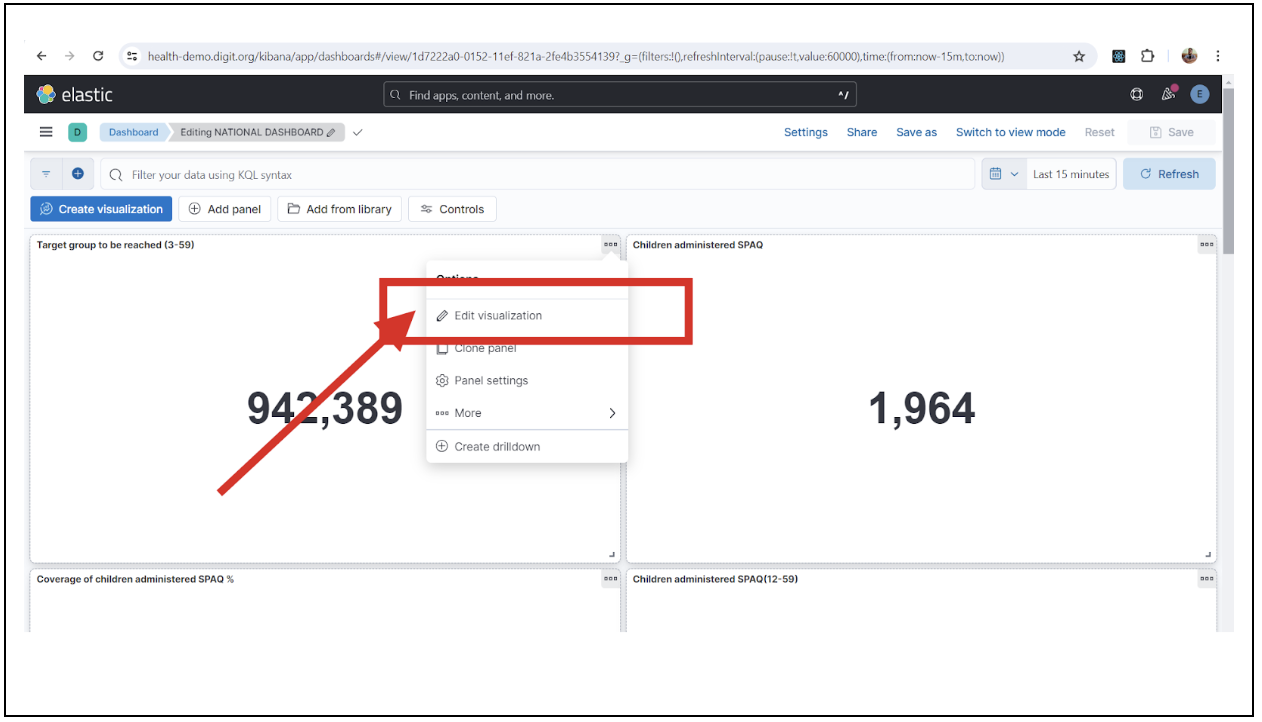
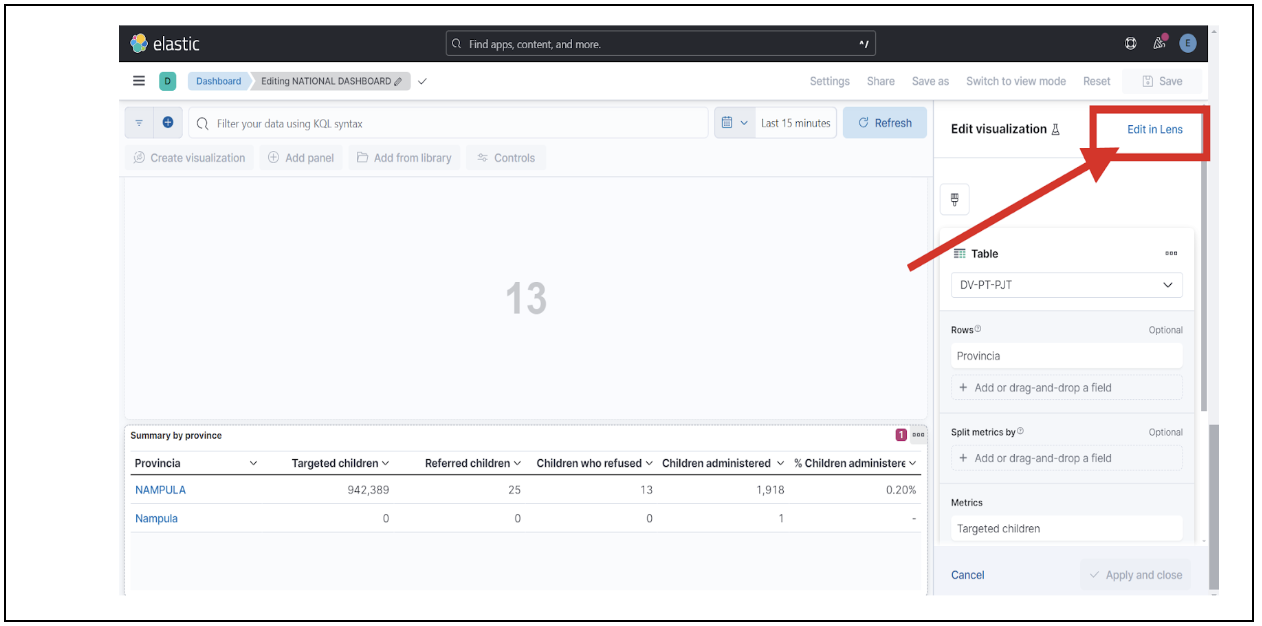
* Click on the “Edit Visualisation” option on the specific chart you want to edit.
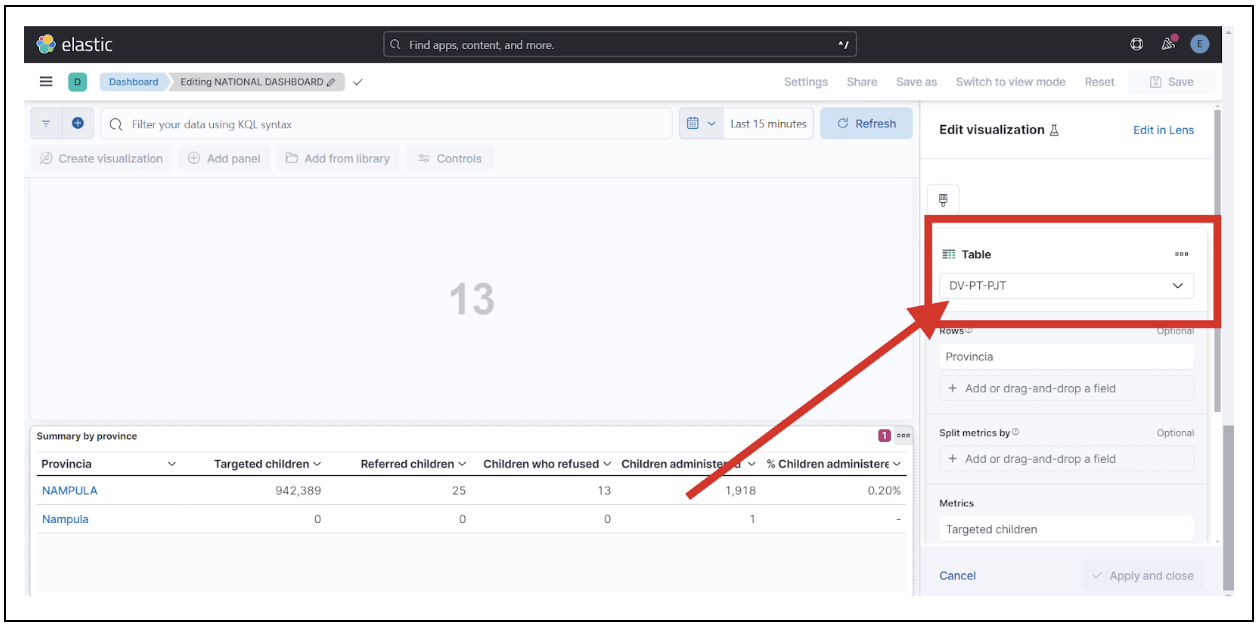
* Check the chart type and data view from which the data is being fetched.
* Click on “Edit Lens” to get an overview of the available and selected fields in the respective data view.
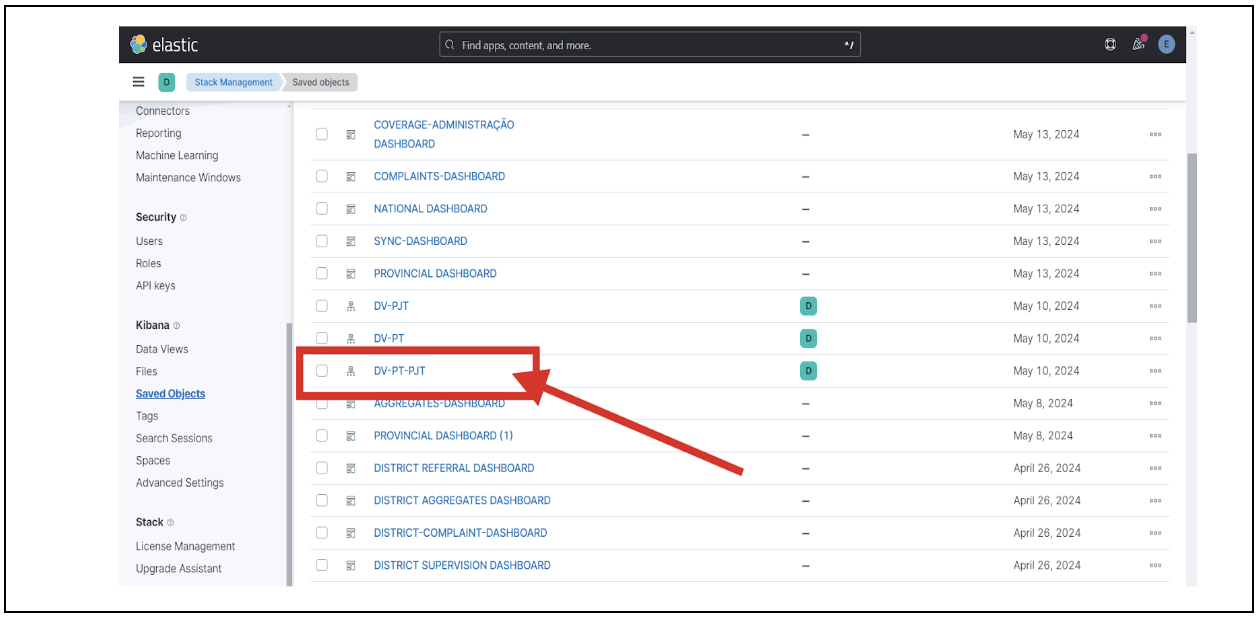
* You can go to the respective data view under Stack Management -> Saved Objects, update the indexes, and add a timestamp filter for the respective chart.
{% endstep %}
{% step %}
### View or edit queries to fetch metric data
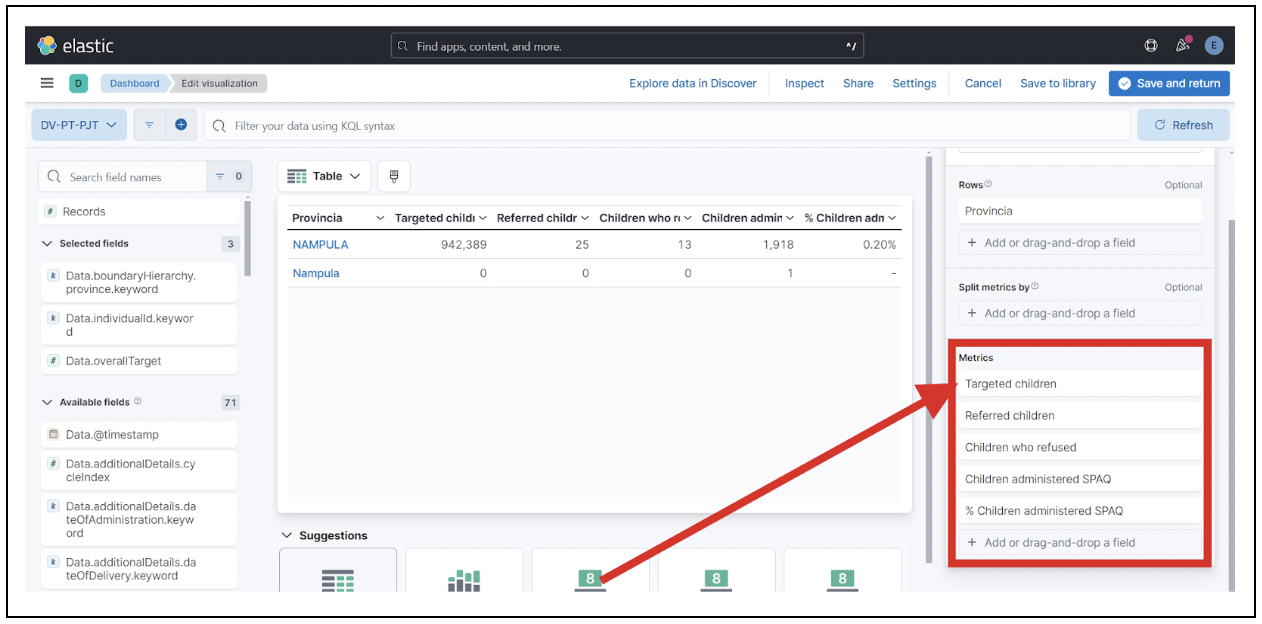
* After going back to the “Edit Visualisation”, you can see the metrics that are shown in the chart here, as shown in the image below:
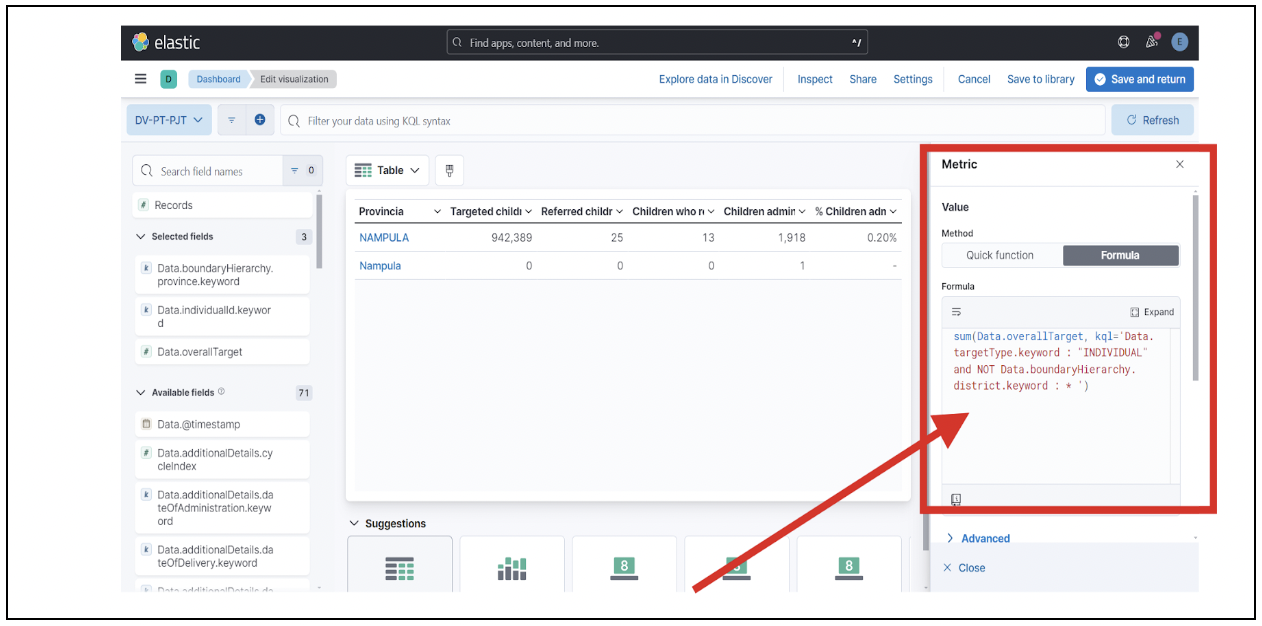
* Click on the desired metric for which you want to view/edit the query.
{% endstep %}
{% step %}
### View data sources
* To see which index a data view is pulling the data from, check the respective data views in Stack Management -> Data Views.
* If you need to create your own data views, follow this guide:[ Creating Data Views in Kibana](https://www.elastic.co/guide/en/kibana/current/data-views.html).
* For example, if you click on “Edit Visualisation” on a chart, you will see that the table chart is getting data from the DV-PT-PJT data view.
* You can then view the DV-PT-PJT data, check the indices from where the data is getting pulled, and add a timestamp filter according to your requirements.
{% endstep %}
{% endstepper %}
---
# Agent Instructions
This documentation is published with GitBook. GitBook is the documentation platform designed so that both humans and AI agents can read, navigate, and reason over technical content effectively. Learn more at gitbook.com.
## Querying This Documentation
If you need additional information that is not directly available in this page, you can query the documentation by asking a question.
Perform an HTTP GET request on the following URL with the `ask` and `goal` query parameters:
```
GET https://docs.digit.org/health/v2.1/deploy/installation/setup-kibana-dashboard/create-or-edit-existing-dashboards.md?ask=&goal=
```
`ask` is the immediate question: it should be specific, self-contained, and written in natural language.
`goal` is what the user is ultimately trying to achieve, the reason they need the answer. Sharing it helps GitBook give you a better, more relevant answer. A goal is most helpful when it describes the outcome the user wants rather than restating the question. For example, with `ask=how do I create an API token`, a goal like `automate deployments from our CI pipeline` lets GitBook tailor the answer to that use case.
The response will contain a direct answer to the question and relevant excerpts and sources from the documentation.
Use this mechanism when the answer is not explicitly present in the current page, you need clarification or additional context, or you want to retrieve related documentation sections.