> For the complete documentation index, see [llms.txt](https://docs.digit.org/llms.txt). Markdown versions of documentation pages are available by appending `.md` to page URLs; this page is available as [Markdown](https://docs.digit.org/platform/guides/operations-guide/observability/logging.md).
# Logging
logging solution in Kubernetes with ECK Operator
In this article, we’ll deploy ECK Operator using helm to the Kubernetes cluster and build a quick-ready solution for logging using Elasticsearch, Kibana, and Filebeat.
### What is ECK?
Built on the Kubernetes Operator pattern, [Elastic Cloud on Kubernetes (ECK)](https://www.elastic.co/guide/en/cloud-on-k8s/current/k8s-overview.html) extends the basic Kubernetes orchestration capabilities to support the setup and management of Elasticsearch, Kibana, APM Server, Enterprise Search, Beats, Elastic Agent, and Elastic Maps Server on Kubernetes.
With Elastic Cloud on Kubernetes, we can streamline critical operations, such as:
1. Managing and monitoring multiple clusters
2. Scaling cluster capacity and storage
3. Performing safe configuration changes through rolling upgrades
4. Securing clusters with TLS certificates
5. Setting up hot-warm-cold architectures with availability zone awareness
### Install ECK
1. In this case we use [helmfile](https://github.com/roboll/helmfile) to manage the helm deployments: helmfile.yaml
```
repositories:
- name: elastic
url: https://helm.elastic.co
releases:
- name: eck-operator
version: 2.2.0
chart: elastic/eck-operator
namespace: monitoring
values:
- ./eck-operator/values.yaml
```
2\. But we can do that just with [helm](https://github.com/elastic/cloud-on-k8s/tree/main/deploy/eck-operator): Installation using helm
```
helm repo add elastic https://helm.elastic.co
helm install elastic-operator elastic/eck-operator -n monitoring --create-namespace
```
After that we can see that the ECK pod is running:
```
kubectl get po elastic-operator-0 -n monitoring
NAME READY STATUS RESTARTS AGE
elastic-operator-0 1/1 Running 0 43s
```
The pod is up and running
### Creating Elasticsearch, Kibana, and Filebeat resources
There are a lot of [different applications](https://www.elastic.co/guide/en/cloud-on-k8s/current/k8s-orchestrating-elastic-stack-applications.html) in Elastic Stack, such as:
* Elasticsearch
* Kibana
* Beats (Filebeat/Metricbeat)
* APM Server
* Elastic Maps
* etc
In our case, we’ll use only the first three of them, because we just want to deploy a classical EFK stack.
Let’s deploy the following in the order:
1. Elasticsearch cluster: This cluster has 3 nodes, each node with 100Gi of persistent storage, and intercommunication with a self-signed TLS-certificate.
```yaml
# This sample sets up an Elasticsearch cluster with 3 nodes.
apiVersion: elasticsearch.k8s.elastic.co/v1
kind: Elasticsearch
metadata:
name: elasticsearch-logging
namespace: monitoring
spec:
version: 8.2.0
nodeSets:
- name: default
config:
# most Elasticsearch configuration parameters are possible to set, e.g: node.attr.attr_name: attr_value
node.roles: ["master", "data", "ingest", "ml"]
# this allows ES to run on nodes even if their vm.max_map_count has not been increased, at a performance cost
node.store.allow_mmap: true
podTemplate:
metadata:
labels:
# additional labels for pods
purpose: logging
spec:
containers:
- name: elasticsearch
# specify resource limits and requests
resources:
limits:
memory: 4Gi
cpu: 2
env:
- name: ES_JAVA_OPTS
value: "-Xms2g -Xmx2g"
count: 3
# request 100Gi of persistent data storage for pods in this topology element
volumeClaimTemplates:
- metadata:
name: elasticsearch-data # Do not change this name unless you set up a volume mount for the data path.
spec:
accessModes:
- ReadWriteOnce
resources:
requests:
storage: 100Gi
storageClassName: gp2
http:
tls:
selfSignedCertificate:
# add a list of SANs into the self-signed HTTP certificate
subjectAltNames:
- dns: elasticsearch-logging-es-http.monitoring.svc.cluster.local
- dns: elasticsearch-logging-es-http.monitoring.svc
- dns: "*.monitoring.svc"
- dns: "*.monitoring.svc.cluster.local"
```
2\. The next one is Kibana: Very simple, just referencing Kibana object to Elasticsearch in a simple way.
```yaml
apiVersion: kibana.k8s.elastic.co/v1
kind: Kibana
metadata:
name: kibana-logging
namespace: monitoring
spec:
version: 8.2.2
count: 1
elasticsearchRef:
name: elasticsearch-logging
namespace: monitoring
http:
tls:
selfSignedCertificate:
disabled: true
```
3\. The next one is Filebeat: This manifest contains DaemonSet used by Filebeat and some ServiceAccount stuff.
```yaml
---
apiVersion: beat.k8s.elastic.co/v1beta1
kind: Beat
metadata:
name: filebeat
namespace: monitoring
spec:
type: filebeat
version: 8.2.0
elasticsearchRef:
name: elasticsearch-logging
kibanaRef:
name: kibana-logging
config:
filebeat:
autodiscover:
providers:
- type: kubernetes
node: ${NODE_NAME}
hints:
enabled: true
default_config:
type: container
paths:
- /var/log/containers/*${data.kubernetes.container.id}.log
setup:
dashboards:
enabled: true
daemonSet:
podTemplate:
spec:
serviceAccountName: filebeat
automountServiceAccountToken: true
terminationGracePeriodSeconds: 30
dnsPolicy: ClusterFirstWithHostNet
hostNetwork: true # Allows to provide richer host metadata
priorityClassName: system-node-critical
containers:
- name: filebeat
resources:
limits:
memory: 1Gi
cpu: 1
securityContext:
runAsUser: 0
volumeMounts:
- name: varlogcontainers
mountPath: /var/log/containers
- name: varlogpods
mountPath: /var/log/pods
- name: varlibdockercontainers
mountPath: /var/lib/docker/containers
env:
- name: NODE_NAME
valueFrom:
fieldRef:
fieldPath: spec.nodeName
volumes:
- name: varlogcontainers
hostPath:
path: /var/log/containers
- name: varlogpods
hostPath:
path: /var/log/pods
- name: varlibdockercontainers
hostPath:
path: /var/lib/docker/containers
---
apiVersion: rbac.authorization.k8s.io/v1
kind: ClusterRole
metadata:
name: filebeat
rules:
- apiGroups: [""] # "" indicates the core API group
resources:
- namespaces
- pods
- nodes
verbs:
- get
- watch
- list
---
apiVersion: v1
kind: ServiceAccount
metadata:
name: filebeat
namespace: monitoring
---
apiVersion: rbac.authorization.k8s.io/v1
kind: ClusterRoleBinding
metadata:
name: filebeat
subjects:
- kind: ServiceAccount
name: filebeat
namespace: monitoring
roleRef:
kind: ClusterRole
name: filebeat
apiGroup: rbac.authorization.k8s.io
```
### Testing
1. First of all, let’s get Kibana’s password: This password will be used to log in to Kibana
```bash
kubectl get secret elasticsearch-logging-es-elastic-user -ojson | jq '.data.elastic' -r | base64 -d
pCda48Ec32qbmFP1wdasd
```
2\. Running port-forward to Kibana service: Port 5601 is forwarded to localhost
```bash
kubectl port-forward svc/kibana-logging-kb-http 5601:5601 -n monitoring
Forwarding from 127.0.0.1:5601 -> 5601
Forwarding from [::1]:5601 -> 5601
```
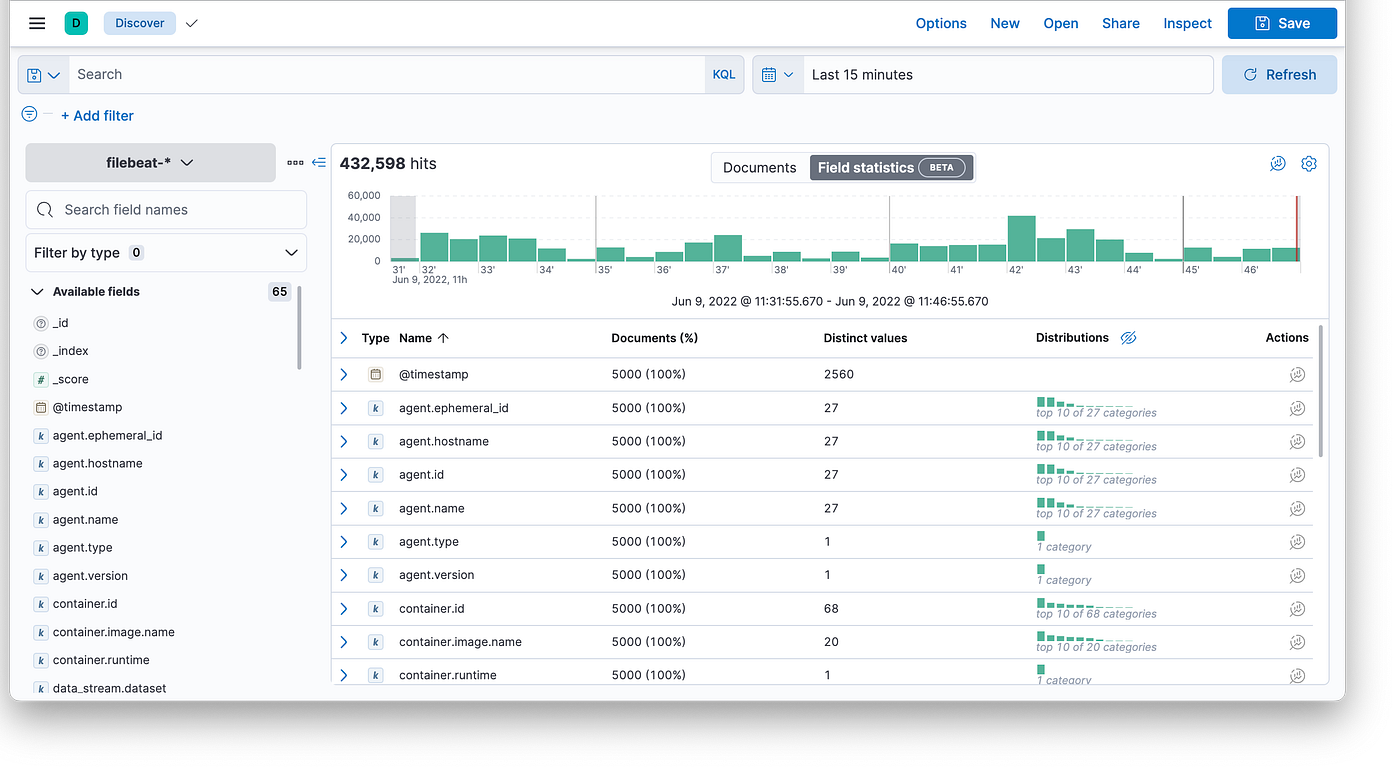
3\. Let’s log in to Kibana with the user `elastic` and password that we got before ([http://localhost:5601](http://localhost:5601/)), go to `Analytics — Discover` section and check logs:

---
# Agent Instructions
This documentation is published with GitBook. GitBook is the documentation platform designed so that both humans and AI agents can read, navigate, and reason over technical content effectively. Learn more at gitbook.com.
## Querying This Documentation
If you need additional information that is not directly available in this page, you can query the documentation by asking a question.
Perform an HTTP GET request on the following URL with the `ask` and `goal` query parameters:
```
GET https://docs.digit.org/platform/guides/operations-guide/observability/logging.md?ask=&goal=
```
`ask` is the immediate question: it should be specific, self-contained, and written in natural language.
`goal` is what the user is ultimately trying to achieve, the reason they need the answer. Sharing it helps GitBook give you a better, more relevant answer. A goal is most helpful when it describes the outcome the user wants rather than restating the question. For example, with `ask=how do I create an API token`, a goal like `automate deployments from our CI pipeline` lets GitBook tailor the answer to that use case.
The response will contain a direct answer to the question and relevant excerpts and sources from the documentation.
Use this mechanism when the answer is not explicitly present in the current page, you need clarification or additional context, or you want to retrieve related documentation sections.