About and Purpose page for National Dashboard Enhancement
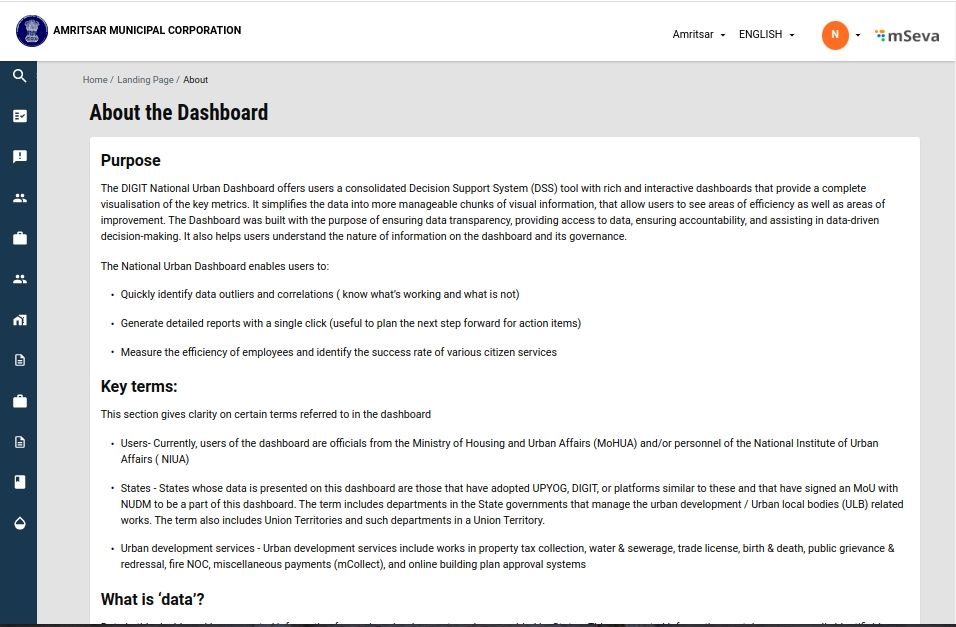
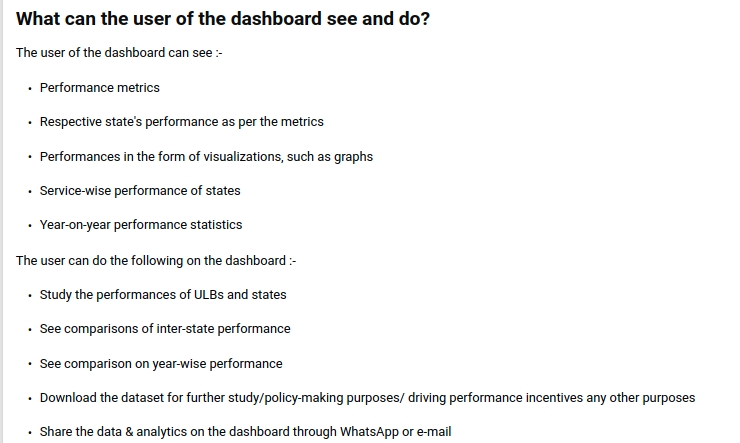
An about the dashboard page that describes the purpose of the dashboard as well as the source of the data is required to be built as per the feedback received from the demos.
Web URL:-mSeva
The file location in Digit-Dev:- ../modules/dss/src/pages/About.js
The file location in egov-mdms-data:- ../../pb/dss-dashboard/About.json
code
OUTPUT
To add a question we need to mention titleHeader
To add the first point we need to mention define
To add the first sub-points we need to mention definePoints
To add the second point we need to mention subdefine
To add the second sub-points we need to mention subdefinePoints
If we need to remove the content we need to delete it according titleHeader,define,definePoints, subdefine, subdefinePoints
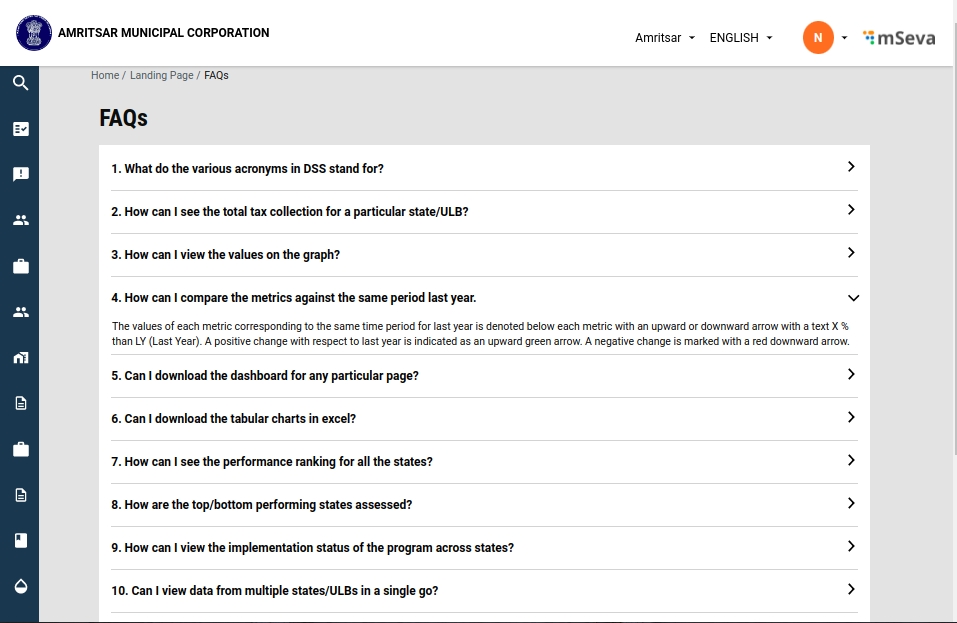
To enhance the dashboard and make it more user-friendly, an FAQ page is to be developed so that users can access it from any page for any queries that they may have regarding any acronyms or how to navigate.
The File location in egov-mdms-data:- ../../pb/dss-dashboard/FAQs.json
code
OUTPUT
To add a question we need to mention question
To add the First point we need to mention answer, ans
To add the First sub-points we need to mention answer, point
To add the Second point we need to mention subAnswer, ans
To add the Second sub-points we need to mention subAnswer, point
If we need to remove the content we need to delete it according question, answer, subAnswer, ans, point
Web URL:-mSeva The File location in Digit-Dev:- ../dss/src/pages/FAQs
Individual DSS configurations like FSM - DSS configuration is built on the DSS module where configuration and data are received from a set of APIs which can be accessed by users with specific user roles.
Role - FSM_ADMIN
Module - FSM
API Curl
Data for each configuration is fetched using {env}/dashboard-analytics/dashboard/getChartV2?_=1627404593531
API CURL -
Each of the charts will have unique data parameters and responses in distinct API calls.
Fundamentally DSS has various functionalities including filtering of data, charts and drill-down charts with download PDF, Image and .XLS files. This is achieved by various components utilizing external plugins and internal services
Filter component in DSS consists of 4 components:-
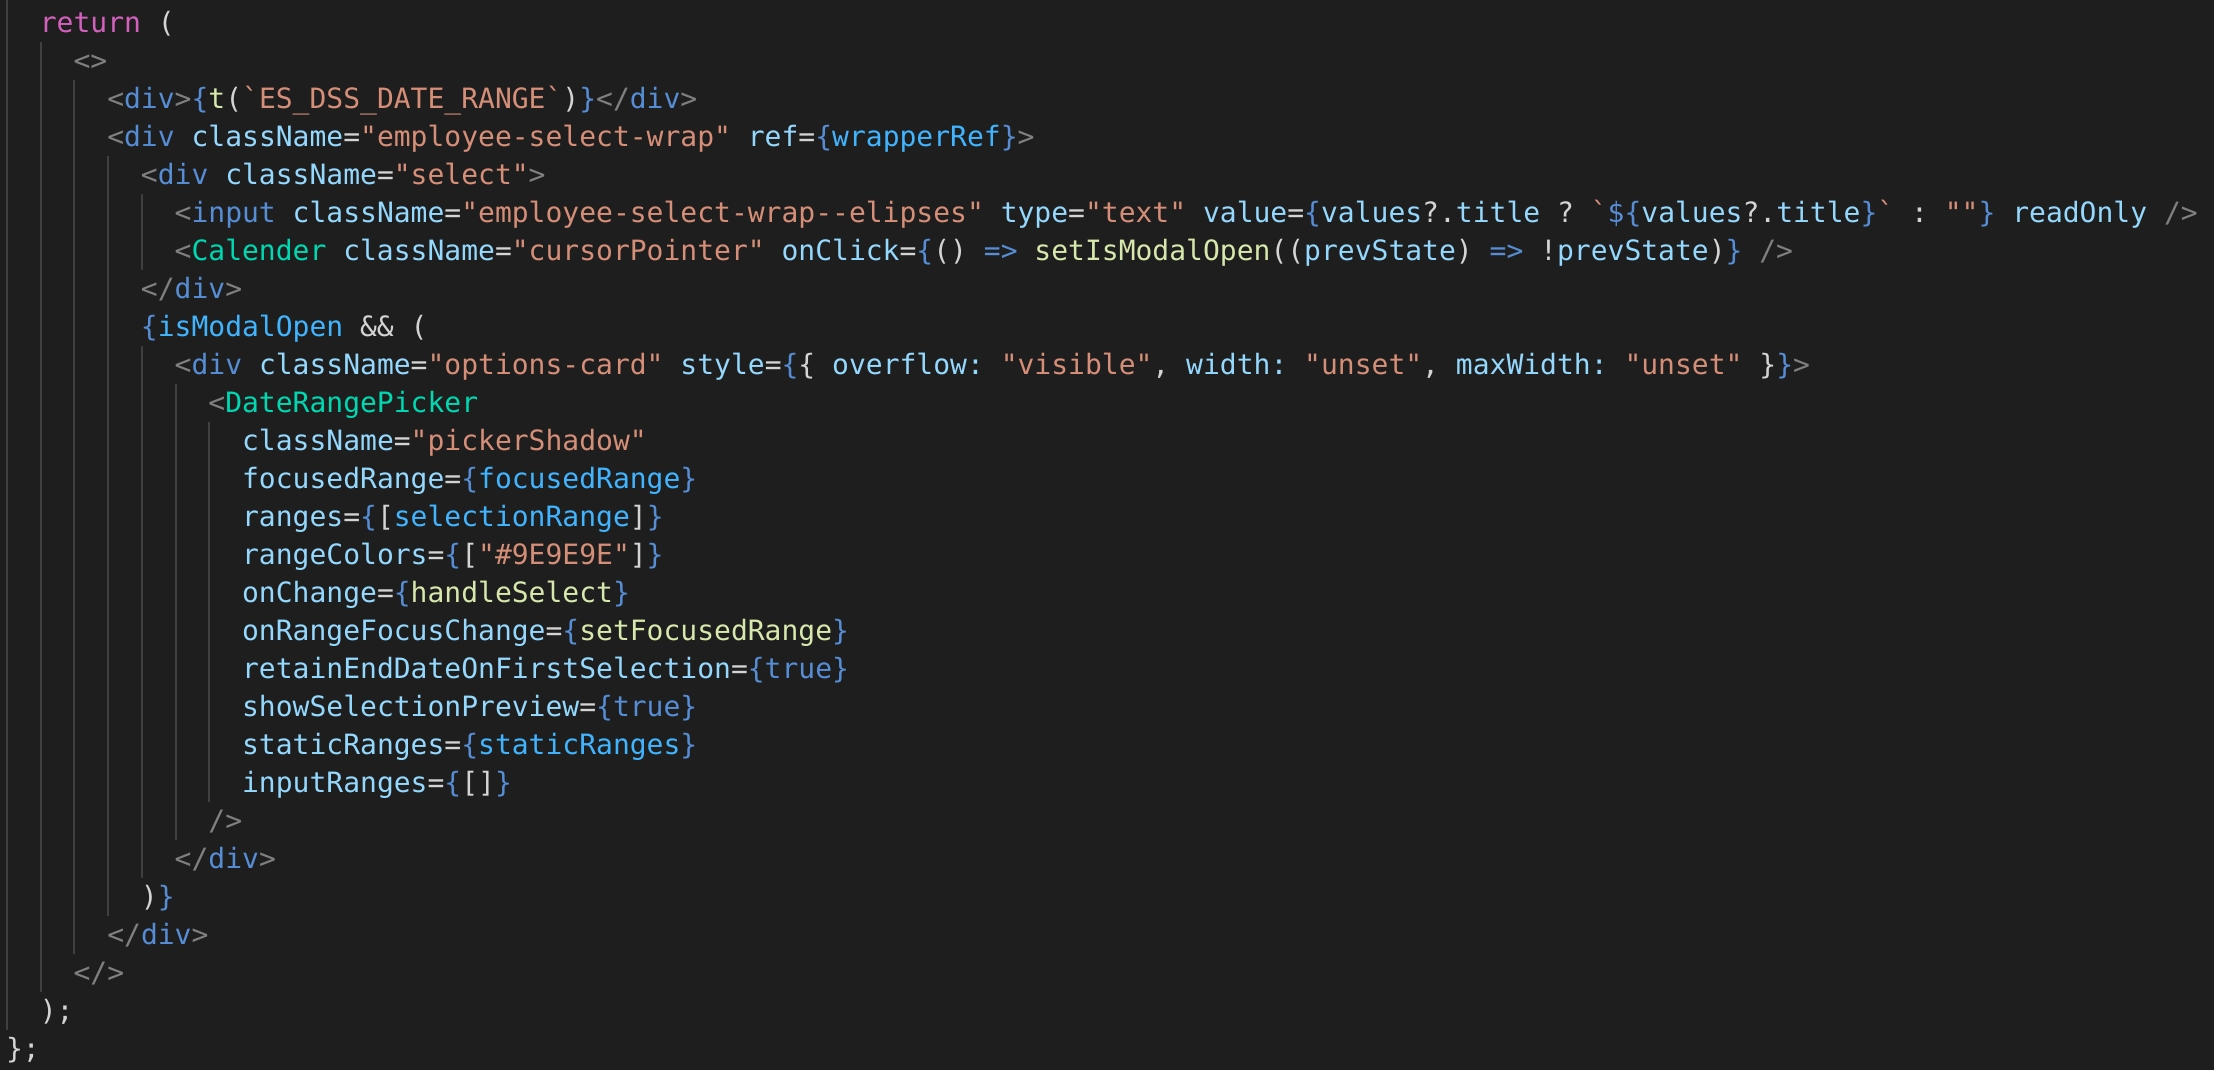
The DateRange component is a styling wrapper around DateRangePicker plugin.
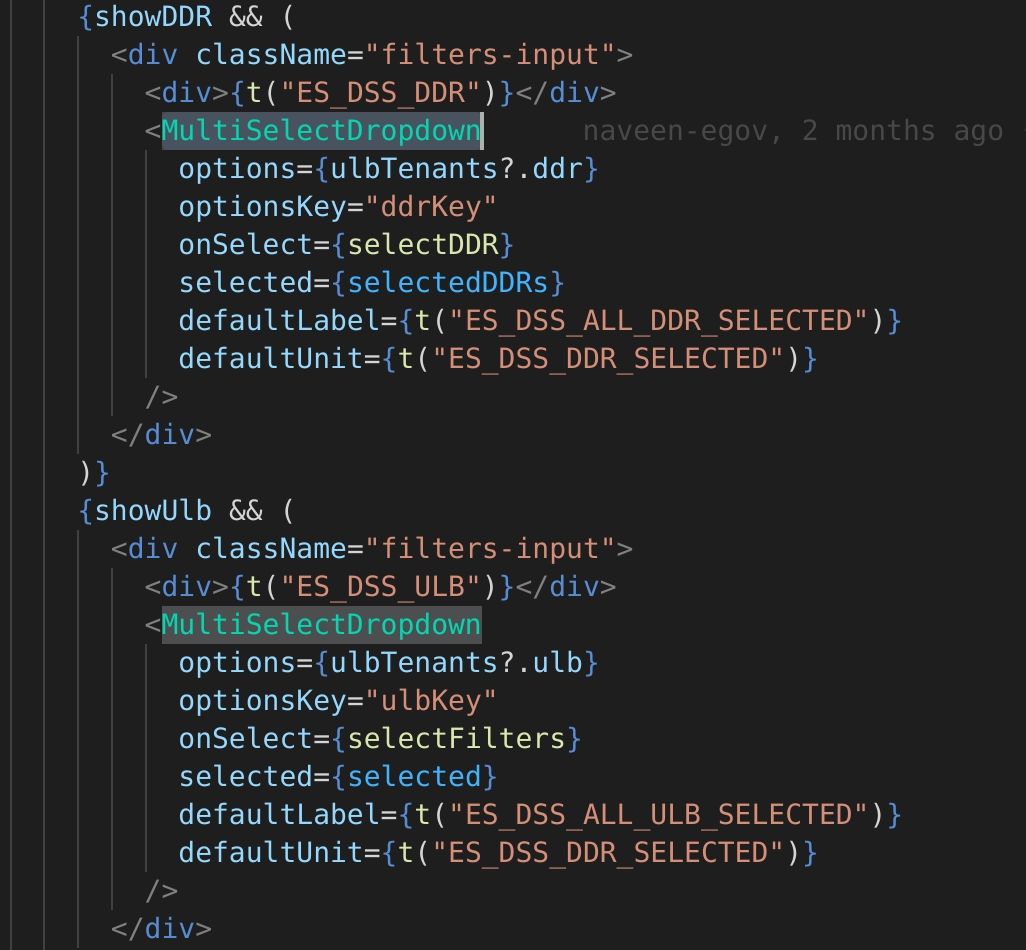
Filter on the basis of ULB and DDR (District) is done by selecting single or multiple instances of DDR/ ULB. DDR is an encapsulation of ULBs, and getChart API filters data on the basis of ULB tenants,
Sample request header -
The component in itself uses MultiSelectDropdown component
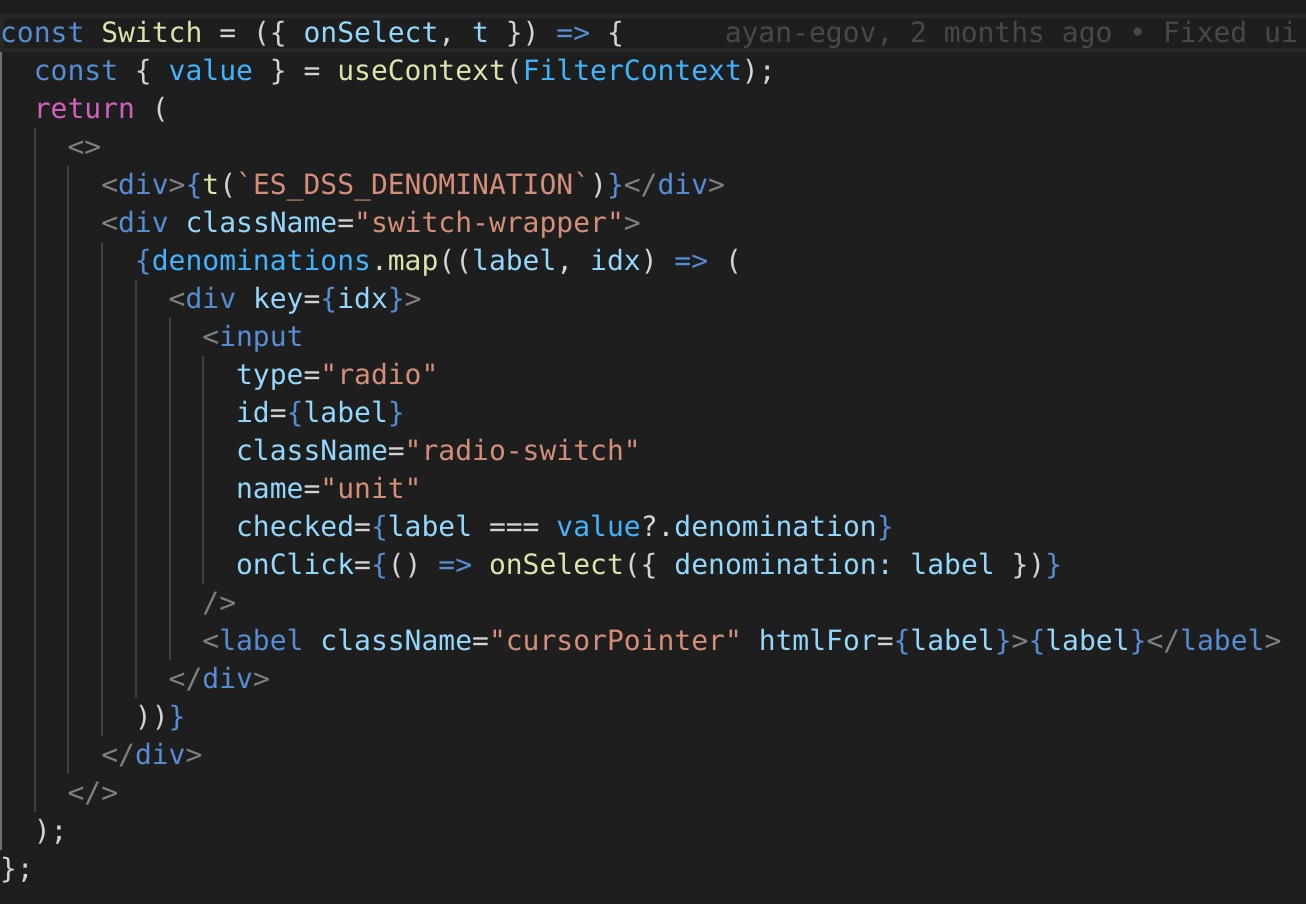
React Component named Switch which uses styled radio inputs.
The GenericChart is a common wrapper for all charts. It adds the basic styles to all the chart components.
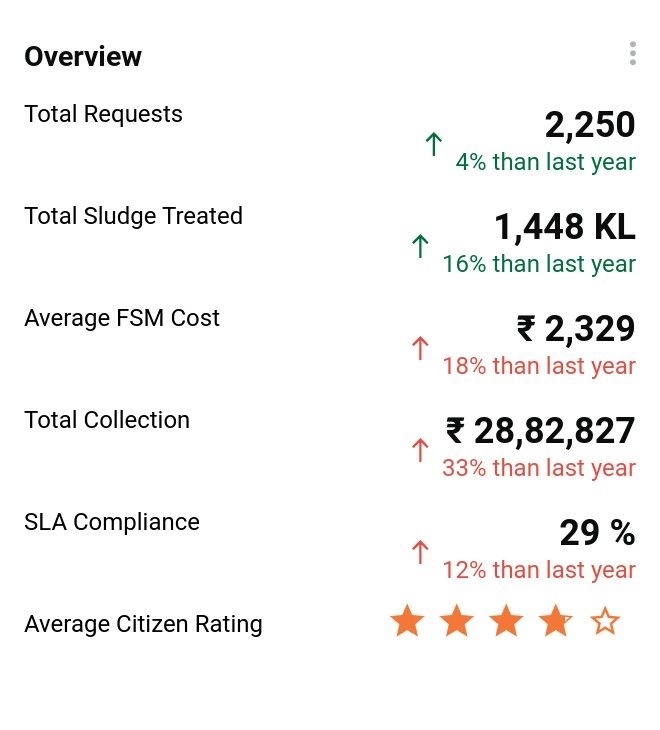
The MetricChart component is a wrapper component around the MetricChartRow component. MetricChartRow component uses getChart API to fetch data for the “METRIC“ chart type. The MetricData component is a styling component used to format data.
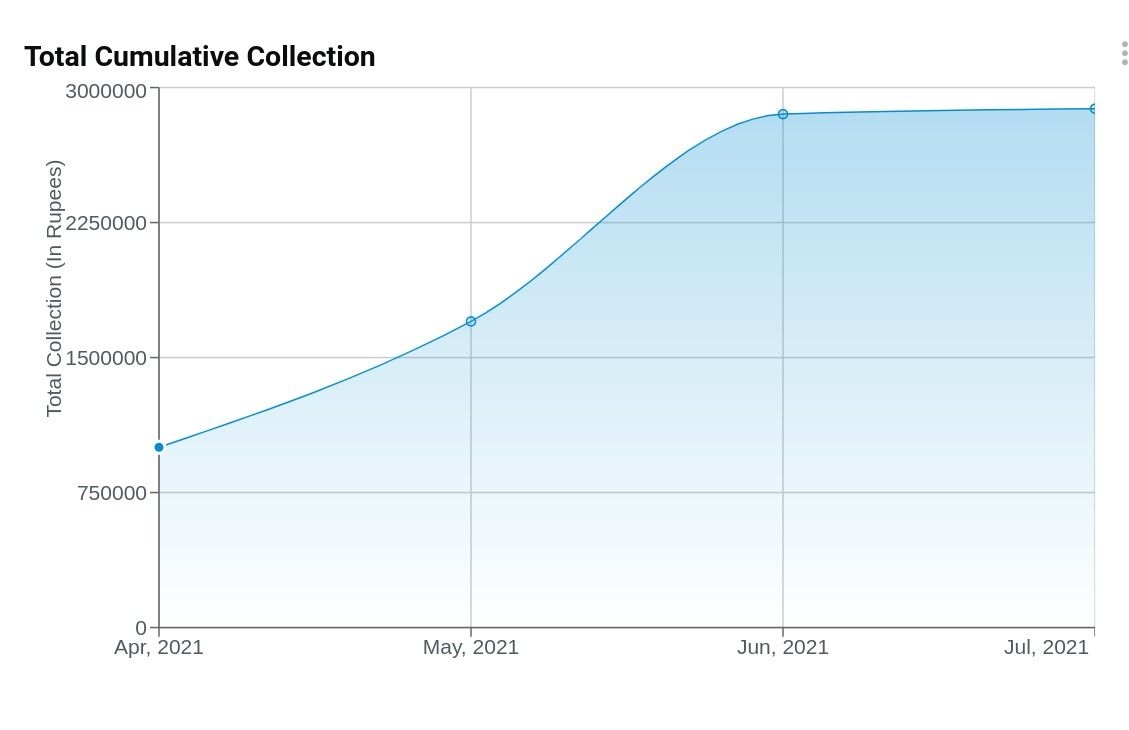
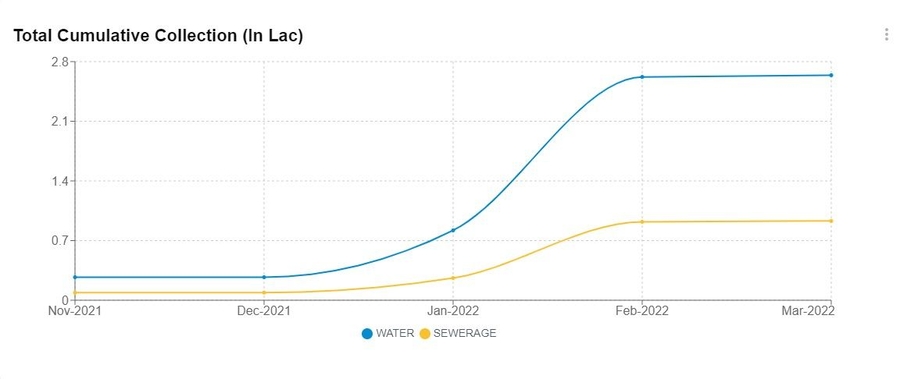
The CustomAreaChart component is used to render line chart types. It can format data based on denomination filter data. It uses the AreaChart component from the recharts package to draw the chart.
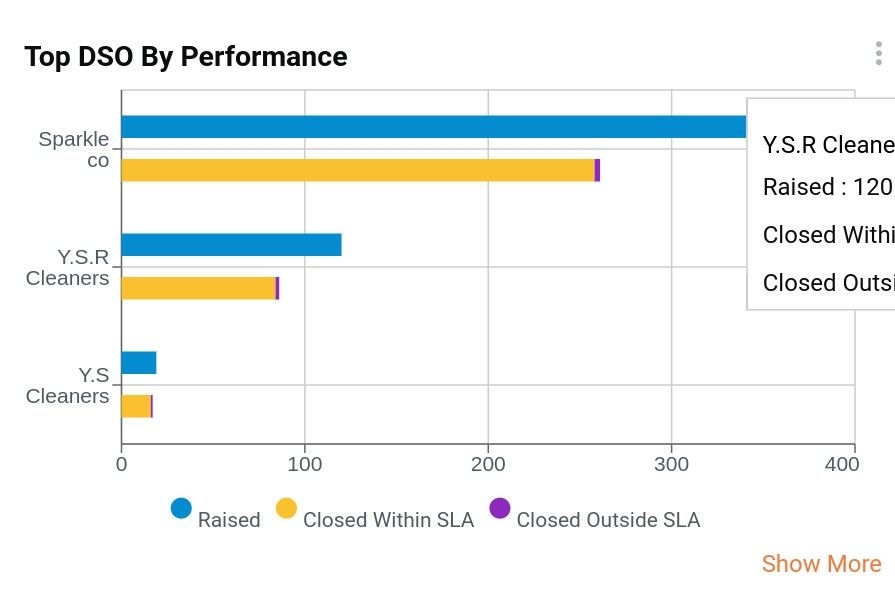
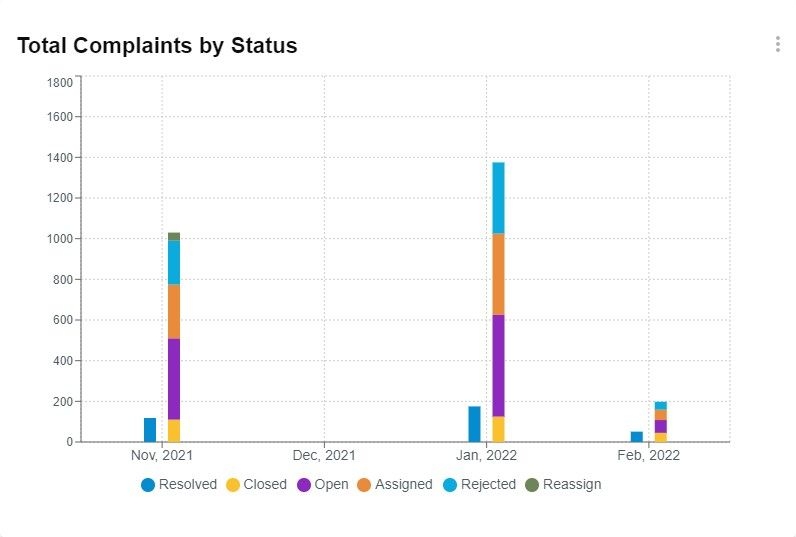
The CustomBarChart component is used to render the performing-metric chart type. It uses the BarChart component from the recharts package to draw the chart.
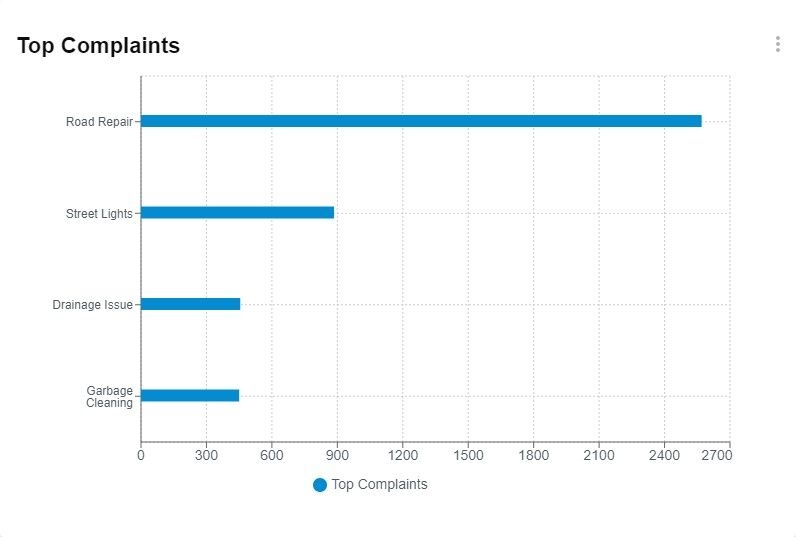
The CustomHorizontalBarChart component is used to render horizontal bar chart type. It uses the BarChart component from the recharts package to draw the chart.
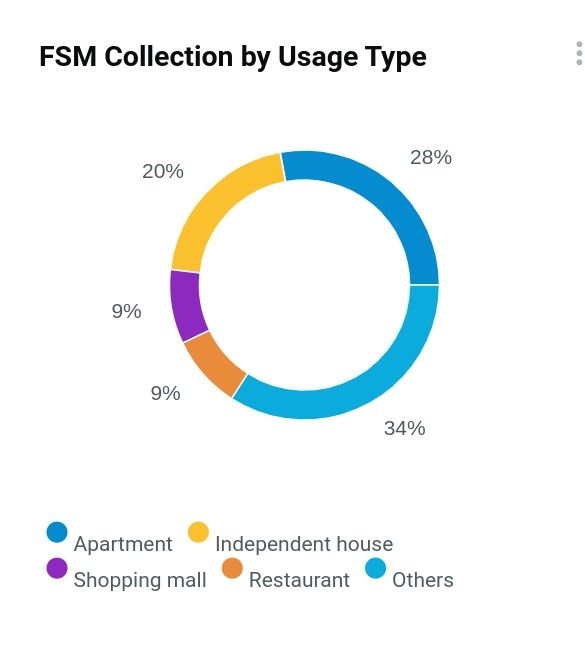
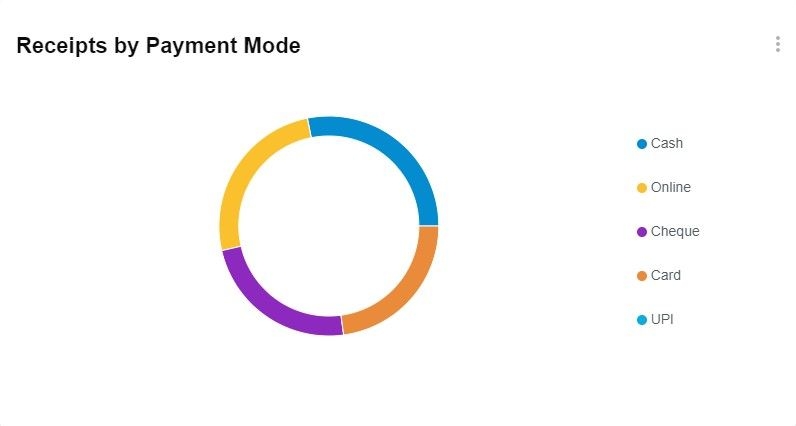
The CustomPieChart component is used to render the doughnut chart type. It displays the top 4 categories and aggregates all the other categories into the “Others“ category. It uses the PieChart component from the recharts package to draw the chart.
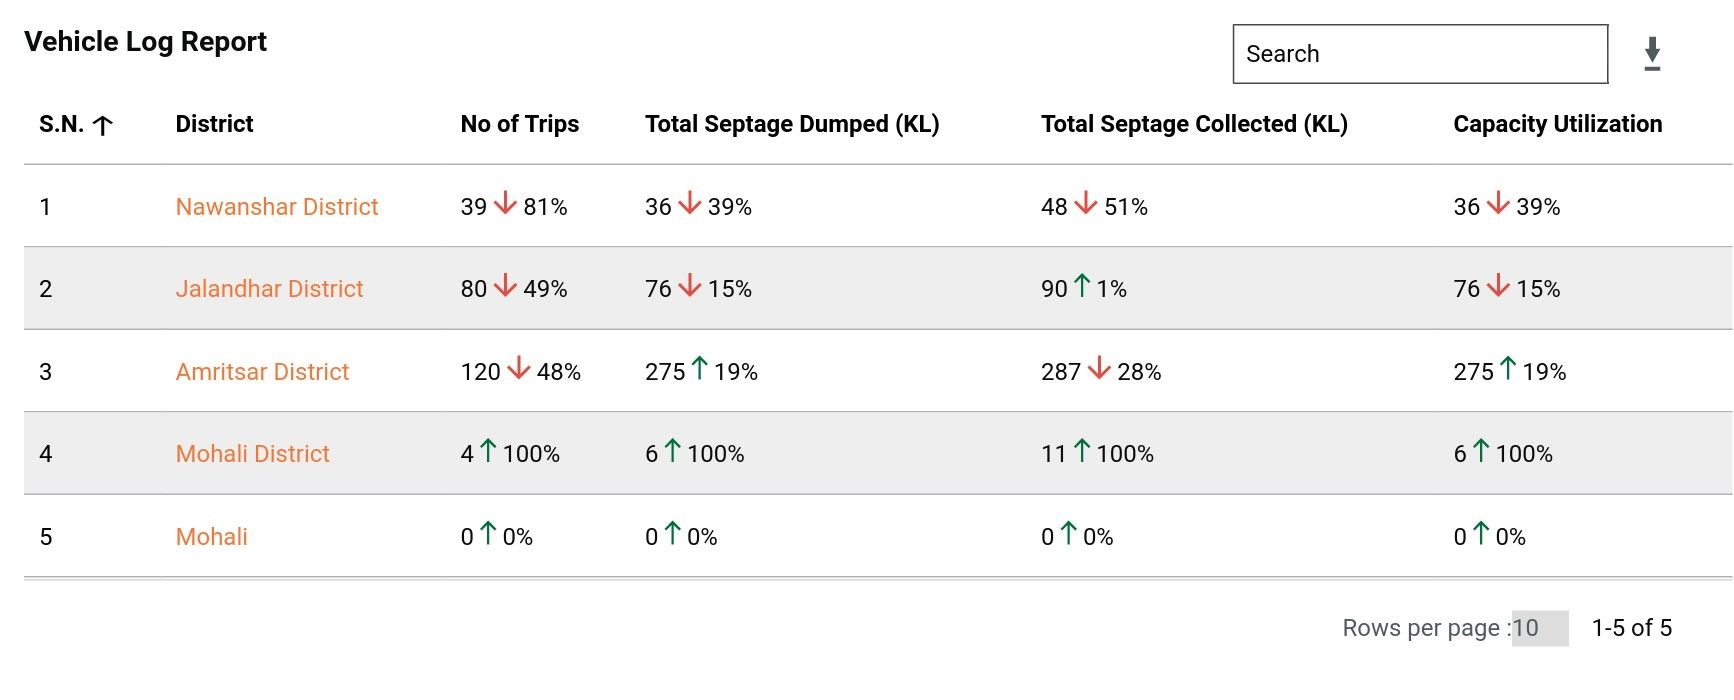
The CustomTable component is used to render table chart types. The insights are calculated by fetching the previous year's data and compared with the current data.
The download service is a common service used by all the chart components to facilitate the download/share pdf option. It is handled by using the JSPDF package.
A decision support system (DSS) is a composite tool that collects, organizes and analyzes business data to facilitate quality decision-making for management, operations and planning. A well-designed DSS aids decision-makers in compiling a variety of data from many sources: raw data, documents, and personal knowledge from employees, management, executives and business models. DSS analysis helps organizations identify and solve problems, and make decisions.
Type Of Users
National Level Admin (NATADMIN)
State Level Admin (STADMIN)
Dashboard List
There are three types of dashboards -
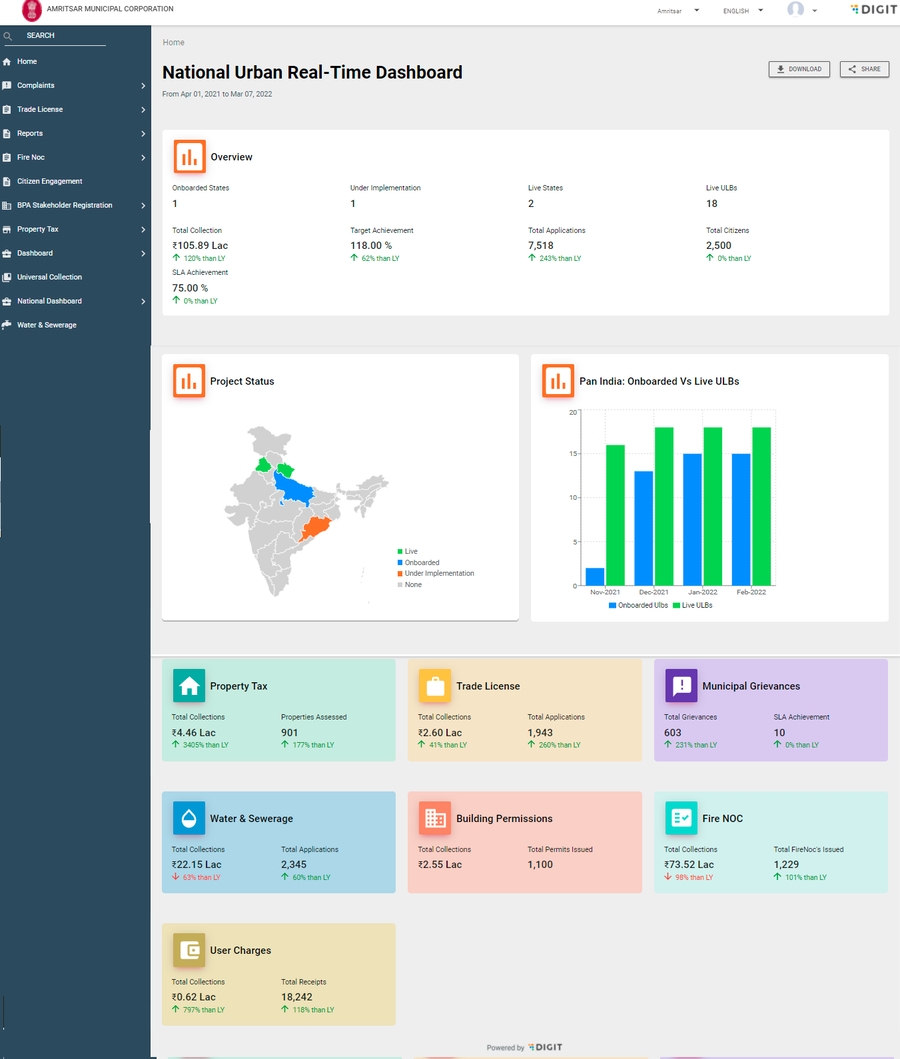
Home page (refer to figure 1).
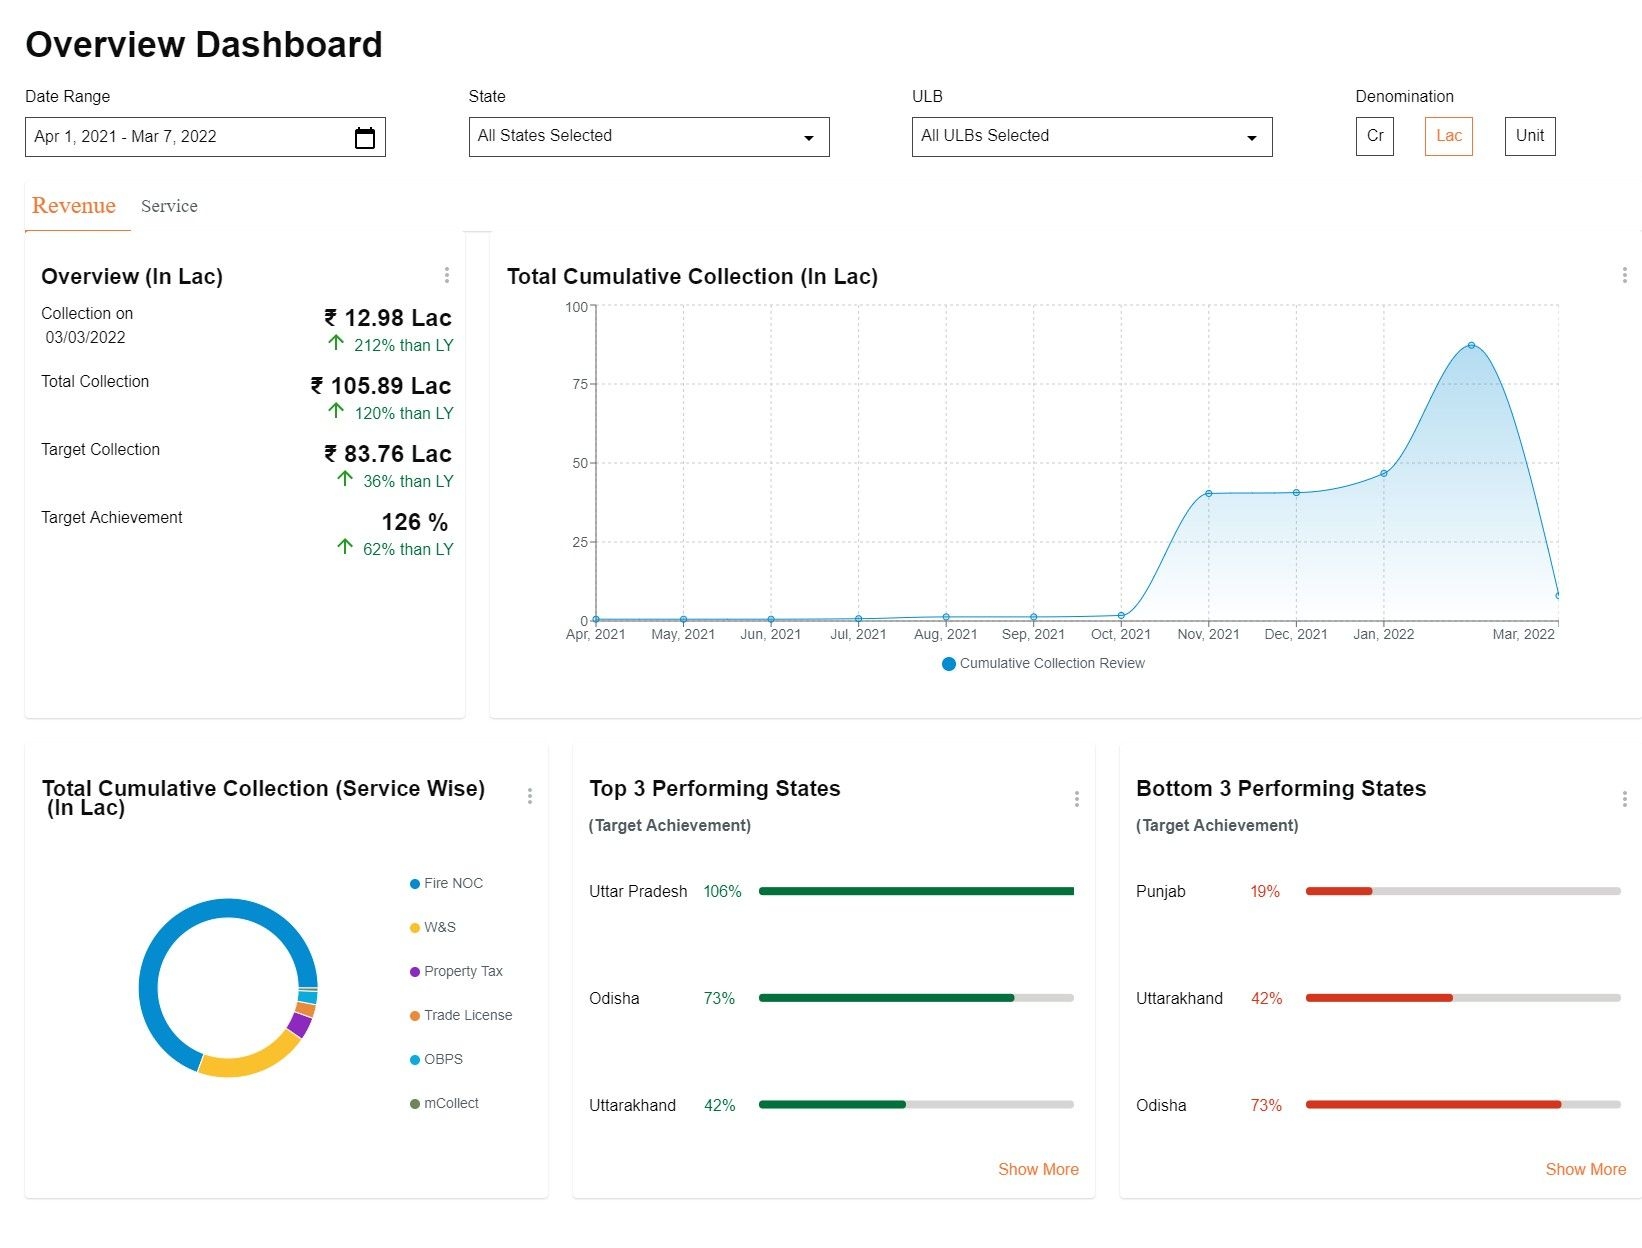
Overview page (refer to figure 2).
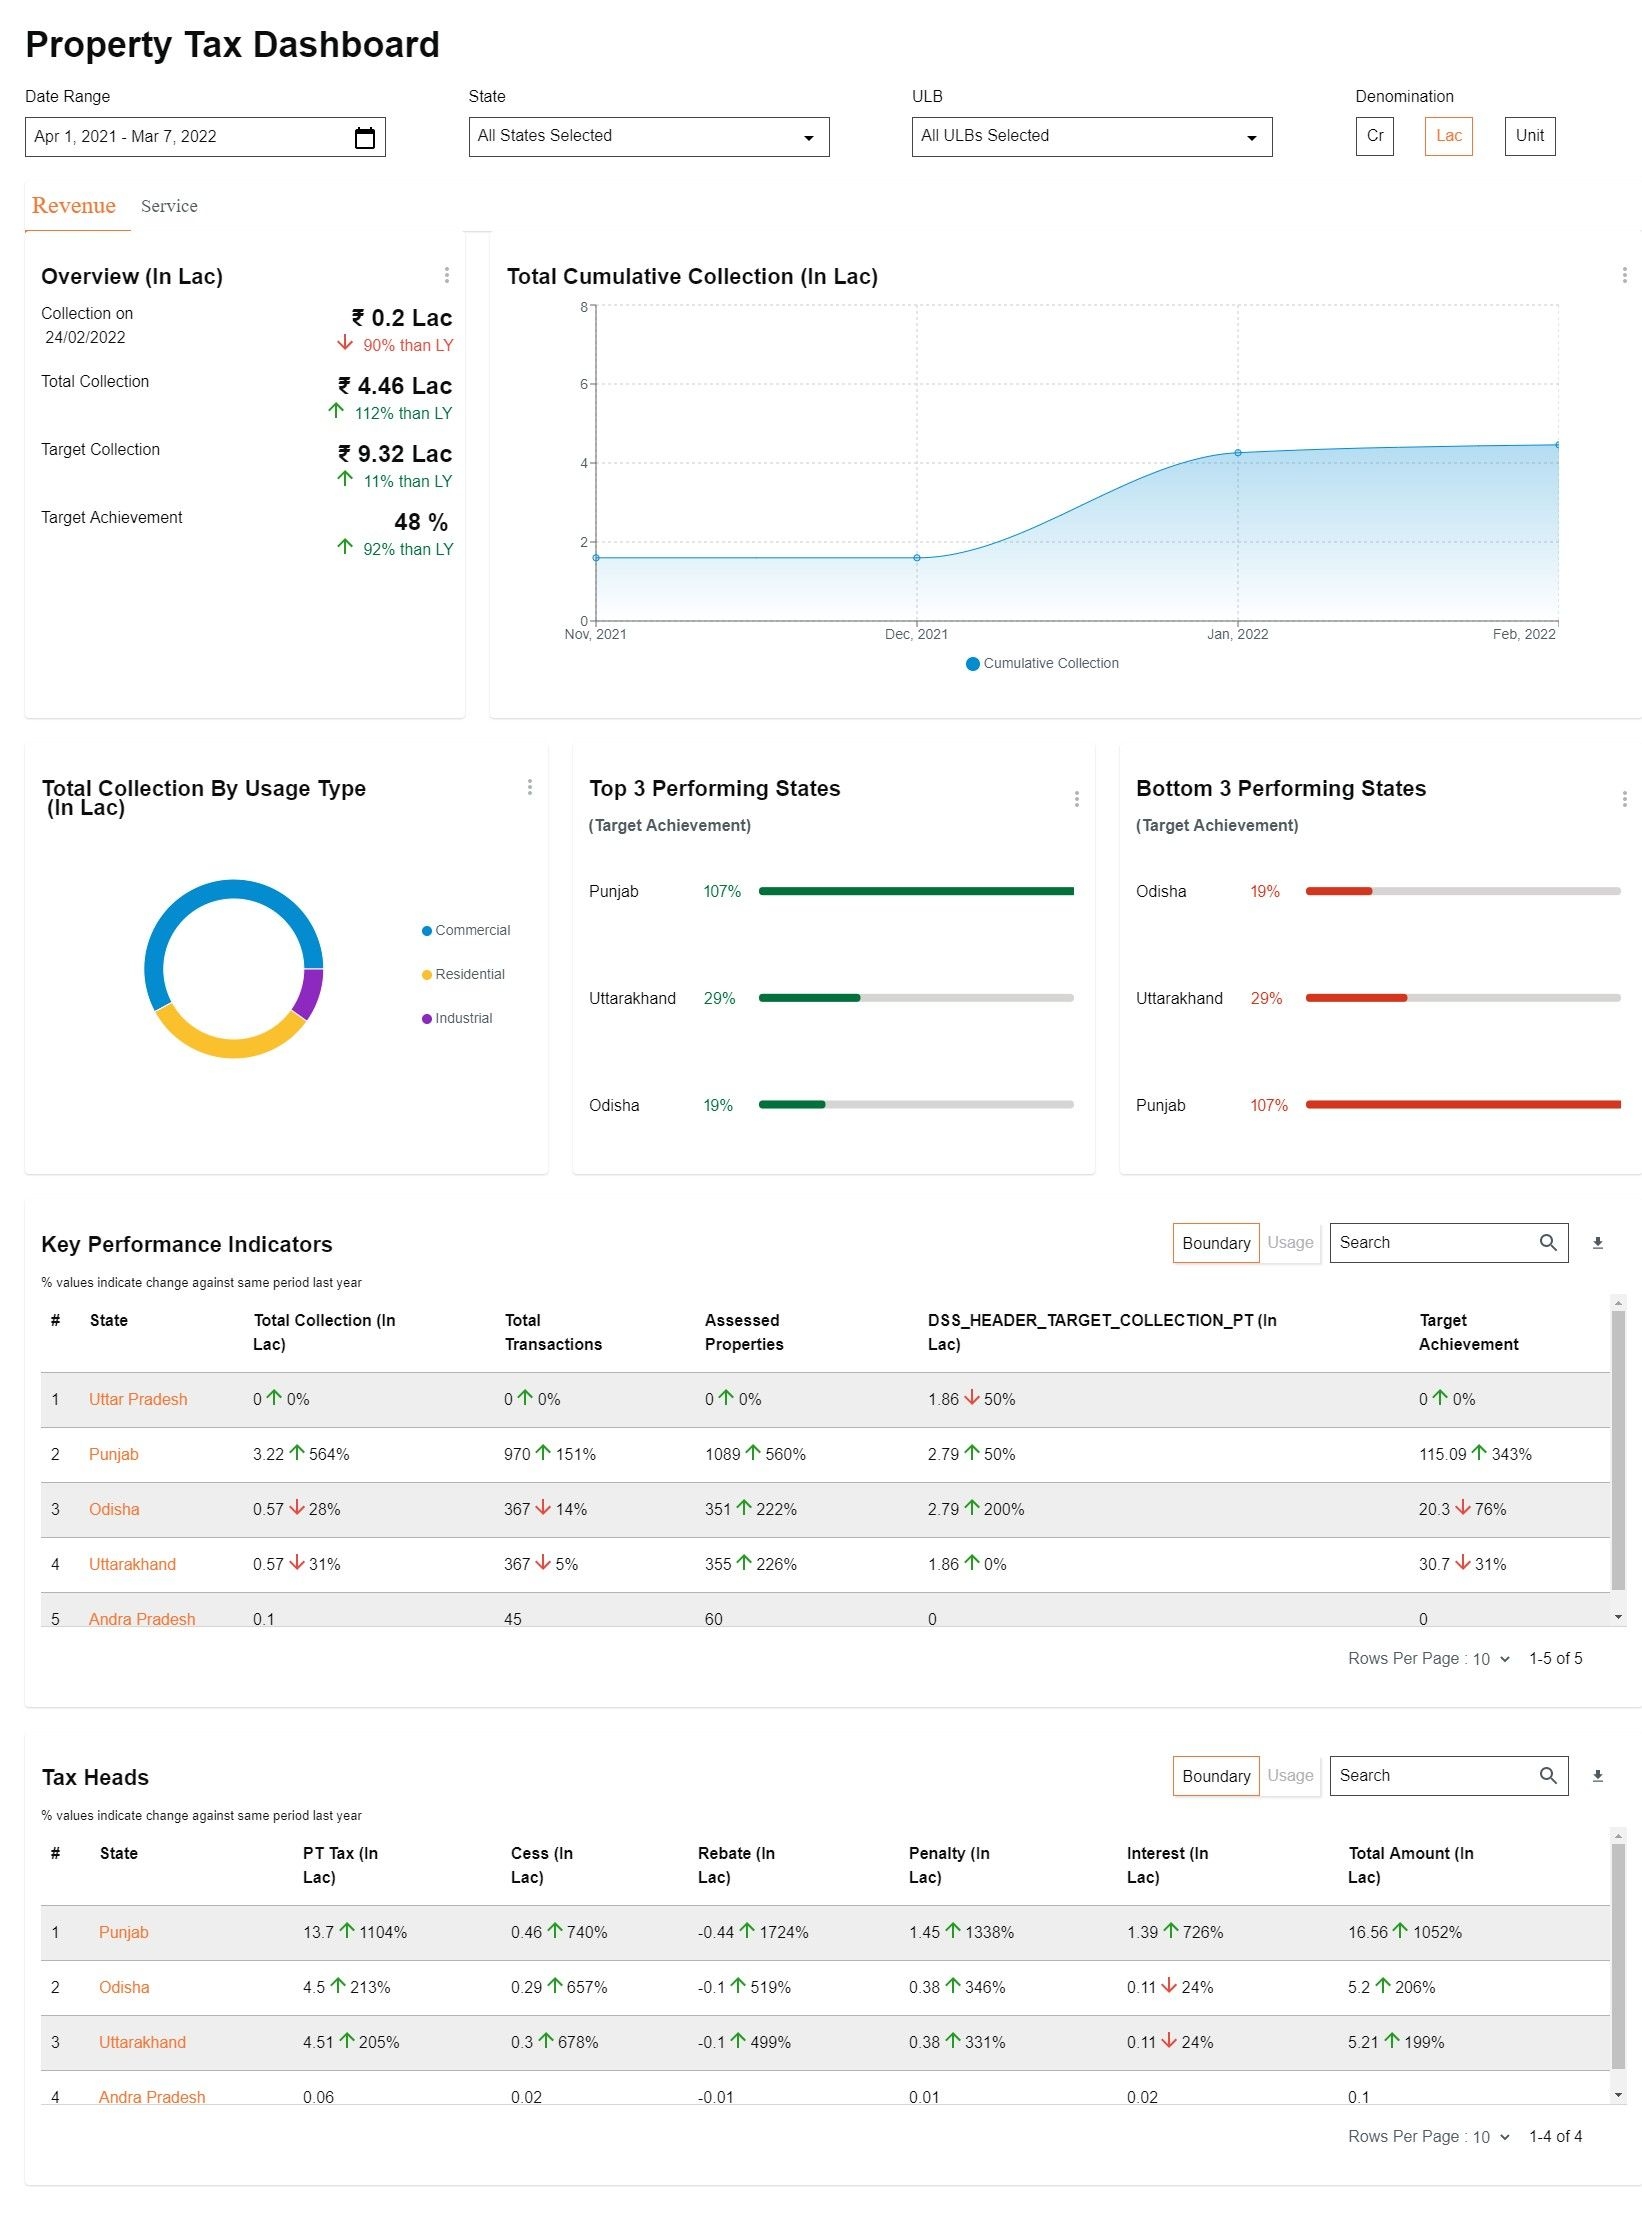
Module-level dashboard (refer to figure 3).
The home page contains multiple cards - each card is clickable.
There are two types of cards, i.e, Overview cards and module-level cards.
Overview and Module level card is differentiated by vizType,
Overview card: Clicking on the Overview card, redirects users to the overview page. vizType for Overview is a collection.
Module Level card: Clicking on the Module level card, redirects users to the Module level dashboards. vizType is module (i.e Property Tax, Trade License etc).
Map chart: This entity displays the total, active ULBs within states where DIGIT is live.
Enable national dashboard: MDMS details
Enable the NDSS in the city module.
Request Payload For Dashboard Config
https://qa.digit.org/dashboard-analytics/dashboard/getDashboardConfig/NURT_DASHBOARD
auth-token: authenticates the request and fetches from the local storage key called Employee.token
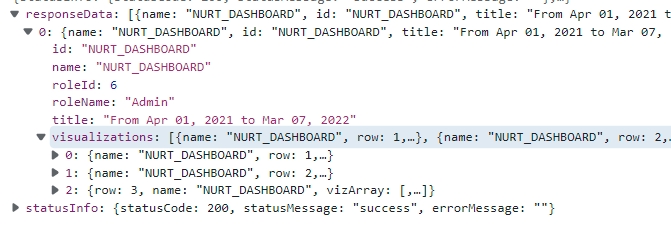
DashboardConfig API Response
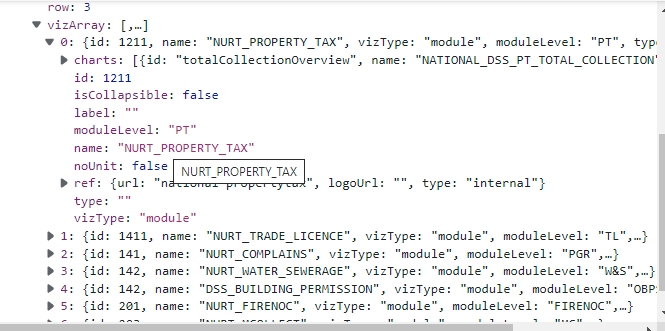
Visualizations: The key contains all configurations for displaying the visualization like rows with charts etc. - refer to figure 1.3. In Figure 1.3, the vizType key defines the module UI.
For Collection Chart & Module Chart refer figure 1
Visualizations List
In the dashboardConfig response visualizations key contains all rows & charts details (refer to figure 1.3).
Each row contains visual details like name, vizType, noUnit, charts etc.(refer to figure 1.3).
name - the name of visualization
vizType - the type of visualization like COLLECTION, MODULE, METRIC-COLLECTION, PERFORMING-METRIC, CHART
COLLECTION - contains collection data and is displayed on the home page (refer to figure 1)
MODULE - contains module-level data and is displayed on the home page (refer to figure 1)
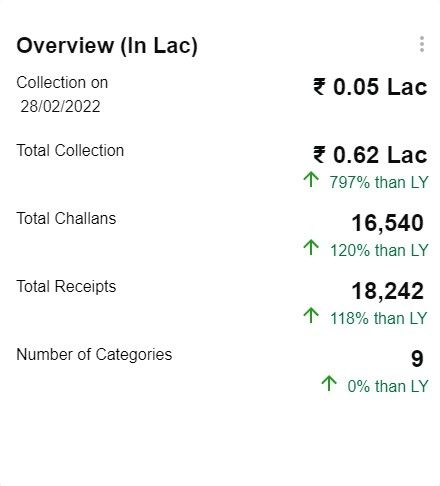
METRIC-COLLECTION - contains collection data and is displayed on Overview/Module level page (refer to figure 2.1)
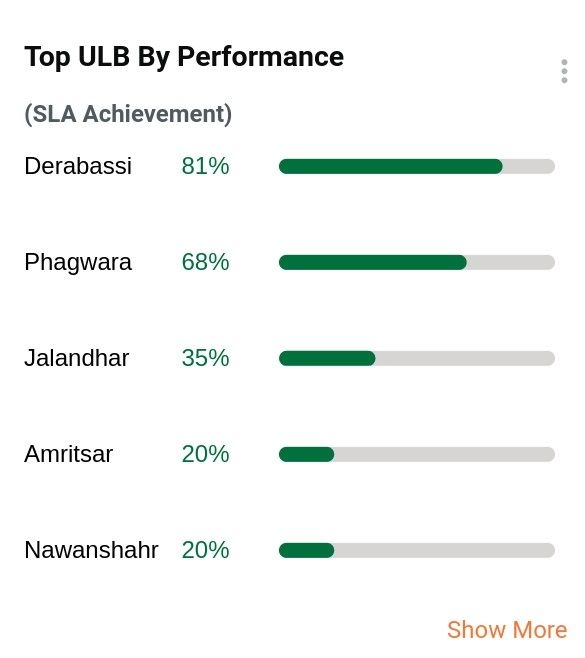
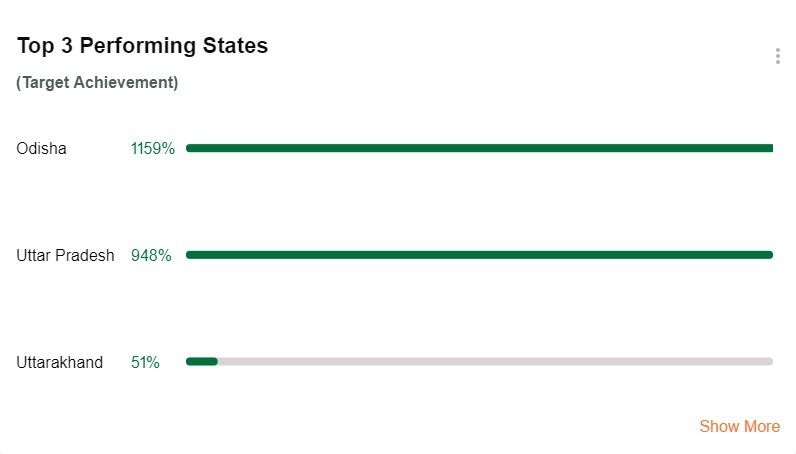
PERFORMING-METRIC - contains top/bottom performing data displayed on Overview/Module level page (refer to figure 2.2).
CHART - contains the below visualizations displayed on Overview/Module level page (refer to figure 2.3 to figure 2.7).
PIE CHART (refer to figure 2.3)
LINE CHART (refer to figure 2.4)
BAR CHART (refer to figure 2.5)
HORIZONTAL BAR CHART (refer to figure 2.6)
TABLE CHART (refer to figure 2.7)
List of visualizations
Figure: 2.1 Collection Metric
Figure: 2.2 Performance Metric
Figure: 2.3 Pie Chart
Figure: 2.4 Line Chart
Figure: 2.5 Bar Chart
Figure: 2.6 Horizontal Bar Chart
Figure: 2.7 Table Chart
Figure: 2.8 Global Filters
Figure: 2.9 Download & Share Button
Global Filters (figure 2.8)
Filters are loaded from MDMS API - https://egov-micro-dev.egovernments.org/egov-mdms-service/v1/_search
egov-mdms-data/nationalInfo.json at QA · egovernments/egov-mdms-data (github.com)
State is fetched from stateCode
ULB from code
Denomination filter: Denomination filter offers three options to display the amount and number in a particular format.
Crore
Lakh
Unit
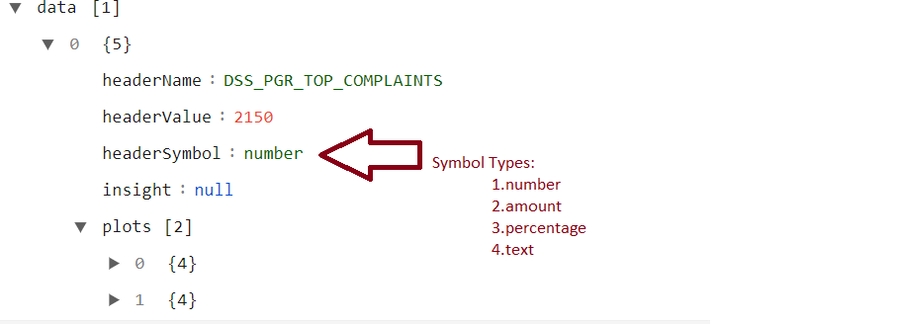
Denomination filter is not applied on the percentage and text (figure 2.10). Type of data is identified by symbol in plots of charts API.
Figure 2.10
Custom Date Filter
If the duration is < 15 days, data is displayed days-wise.
If duration <= 30 days, data is displayed week-wise.
If duration >30, data is displayed monthly wise.
Tabs
Currently, the dashboard has two types of tabs -
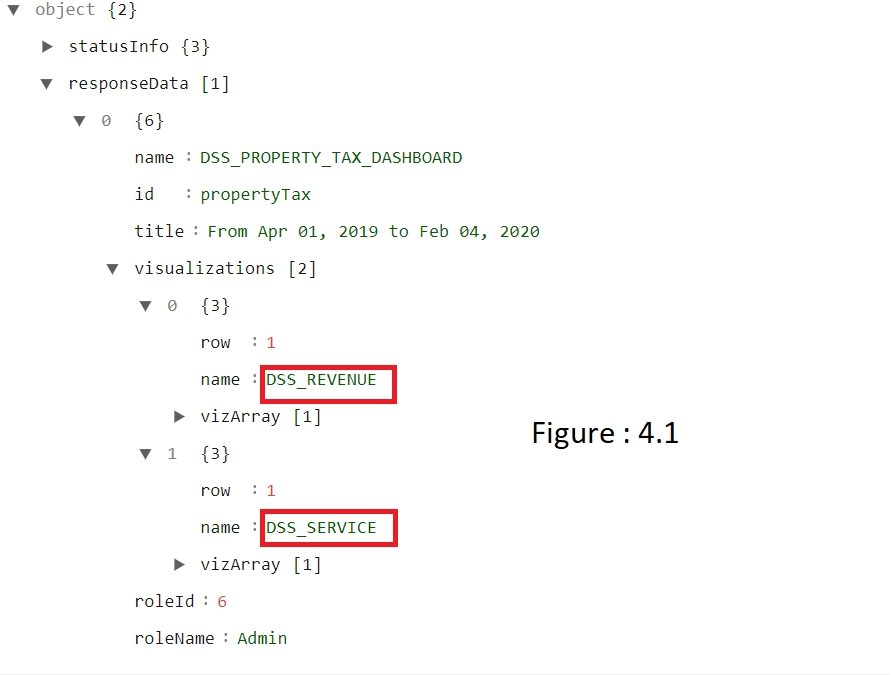
Revenue (figure: 4.1)
Service (figure: 4.1)
Tabs are identified by name in visualizations of config API.
Table chart with drill-down
Table chart visualizations have normal material UI data table features like search, sort etc.
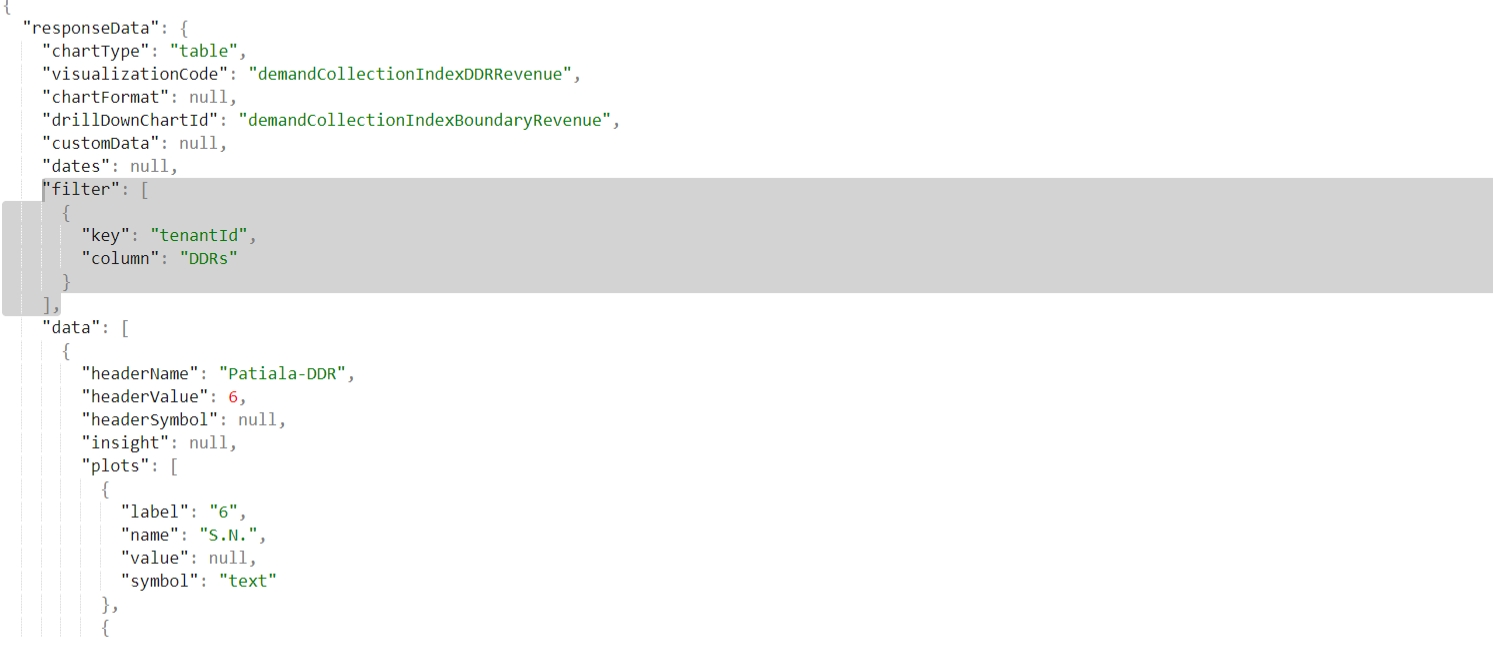
In the table response filter key & drillDownChartId has a value that indicates it is a drill-down table.
Cards
Each card header is localized and has an info icon with a tooltip option which displays the header and the description.
The number of cards in rows on the page is driven by the backend. The backend provides a row number to each card where it should be displayed.
The card contains an option icon that contains the image download and image share options.
Image download and share option use id from vizArray in order to differentiate each card on a page.
Download and Share (figure 2.9)
The download has two options - download as an Image or PDF
Share: Share creates the Image/PDF and uploads it S3 using the below API and returns file id - /filestore/v1/files
Using file Id calls the following API - /filestore/v1/files/url
Each S3 image is shortened using the following API - /egov-url-shortening/shortener
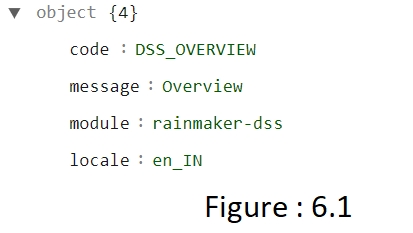
Upload localization keys:
code: pre-defined key for back-end
message: message contains the value for the key
module: rainmaker-dss
locale: contains locale data
Contact eGov team for more details
Module name: rainmaker-dss
NPM Module Used
Note:: Consider this while pushing new State data - both MDMS state names and codes should be in sync
1. Map component: https://raw.githubusercontent.com/egovernments/egov-mdms-data/DEV/data/pb/dss-dashboard/dashboard-config.json
Where id is state code and name is state name.
2. Global Filter: https://raw.githubusercontent.com/egovernments/egov-mdms-data/QA/data/pb/tenant/nationalInfo.json
If the values are pushed under different names then the existing file is updated accordingly.
Steps to setup DSS in local
Step 1: Run as independent, switch to micro-ui-internals folder
Step 2: Run yarn install and yarn start:dev to start working on DSS in a local setup.
API
Roles
/localization/messages/v1/_search
/egov-mdms-service/v1/_search
/dashboard-analytics/dashboard/getDashboardConfig/national-ws
NATADMIN
/dashboard-analytics/dashboard/getDashboardConfig/national-tradelicense
NATADMIN
/dashboard-analytics/dashboard/getDashboardConfig/national-propertytax
NATADMIN
/dashboard-analytics/dashboard/getDashboardConfig/national-pgr
NATADMIN
/dashboard-analytics/dashboard/getDashboardConfig/NURT_DASHBOARD
NATADMIN
/dashboard-analytics/dashboard/getDashboardConfig/nss-obps
NATADMIN
/dashboard-analytics/dashboard/getDashboardConfig/national-firenoc
NATADMIN
/dashboard-analytics/dashboard/getDashboardConfig/national-mcollect
NATADMIN
/dashboard-analytics/dashboard/getDashboardConfig/national-overview
NATADMIN
Supporting links
Code Git Repos: DIGIT-OSS/frontend/micro-ui/web/micro-ui-internals at master · egovernments/DIGIT-OSS
State names are configured in the dashboard-config. egov-mdms-data/dashboard-config.json at DEV · egovernments/egov-mdms-data
