DIGIT Docs
v1.7
  • DIGIT Knowledge Base
  • Local Governance
v1.7
  • 👋Introducing Health
    • Release Notes
      • HCM v1.7 Release Notes
        • Release Checklist
        • Eligibility Checklist
        • Service Build Updates
      • HCM v1.6 Release Notes
        • Service Build Updates
        • Release Checklist
        • Migration from v1.5 to v1.6
      • HCM v1.5 Release Notes
        • Migration from v1.4 to v1.5
        • Service Build Updates
        • Release Checklist
      • HCM v1.4 Release Notes
        • Migration from v1.3 to v1.4
        • Service Build Updates
        • Release Checklist
      • v1.3 Release Notes
      • v1.3 Tech Release Summary
        • Master Data Management Service (MDMS) & Configuration Updates
        • Test Cases
        • Service Build Updates
      • v1.2 Release Notes
      • v1.0 Release Notes
  • Product Roadmap
  • 💙HEALTH CAMPAIGN MANAGEMENT
    • Understanding Health Campaign Management (HCM)
    • Value Proposition
  • 🎯HCM PRODUCT SUITE
    • Functional Specifications
      • Campaign Type Setup
      • Campaign Setup
      • Inventory
      • Boundary Hierarchy
      • Beneficiary
      • Boundary Data Specs
      • Draft System User Setup
      • Role Action Mapping
    • Building Blocks & Services
    • Health Products
      • HCM App
        • User Manual
          • Single Round Campaigns
            • Registration & Delivery
              • Registration & Delivery: IRS
          • Multi-Round Campaigns
            • Registration & Delivery
            • Download Beneficiary Data
          • Common Functions
            • User Management
            • 2D Voucher Scanning
            • Proximity-Based Search
            • Voucher-Based Registration and Distribution
            • Tracking Beneficiary Referrals
            • Tracking Side-Effects for Beneficiaries
            • Tracking Adverse Events
            • Health Facility Referral
            • Raising Complaints
            • Resolving Complaints
            • Inventory Management
              • User Manual
                • Stock Management
                • Stock Reconciliation
                • View Reports
                • Bale Scanning
            • Attendance Management
            • Payments
              • Guide to HCM Payments
            • Community Living Facilities
              • Product Requirement Document
          • Support Functions
            • Language Selection
            • Login
            • Forgot Password
            • Project Selection
            • Hamburger Menu
            • Help
            • Sync
            • Checklist
      • Campaign Management Dashboard
        • User Manual
        • Configurations
          • MDMS Configurations and s3 assets
          • IRS Dashboard Chart Configurations
        • Kibana Dashboard Integration With DSS Module
          • Auth Proxy Setup and Configuration for Kibana
        • SMC Dashboard
      • Microplanning
      • HCM Console
      • Health Payments
        • MDMS Configurations
        • Attendance Update and Approval Process
          • Project Selection
          • Register Inbox
          • View Attendance:Edit And Approve
        • Bill Generation Process
          • Project And Bill Aggregation
          • Bill Generation
          • My Bills
  • 🚀REFERENCE IMPLEMENTATIONs
    • Mozambique
      • LLIN Overview
      • Customisation
      • Rollout
  • 🧰TECHNOLOGY
    • Architecture
      • High Level Design
        • Health Campaign System High Level Design
        • Design Decision Log
      • Low Level Design
        • Registries
          • Individual
          • Household
          • Product
          • Facility
          • Attendance
          • Expense
        • Services
          • Project
          • Stock
          • Referral
          • Muster Roll
          • Expense Calculator
      • Field App Architecture
        • UI Packages
          • Closed HouseHold package
          • Registration & Delivery Package
            • Eligibility Checklist
            • Communal Living Facilities
          • Referral Reconciliation Package
          • Inventory Management Package
          • Attendance Management Package
          • DIGIT Scanner Package
          • Digit Showcase Package
          • Digit Data Model Package
          • DIGIT DSS Package
          • Complaints Package
          • Survey Form Package
          • Sync Service Package
    • Standards
    • Security
    • Interoperability
  • 🪝SETUP
    • Planning an HCM Implementation
    • Establish Project & Team
    • Gathering Requirements
    • Installation
      • Install Using GitHub Actions in AWS
      • System Data Setup
      • Project Data Setup
      • Setup Mobile App
      • Setup Kibana Dashboard
        • Create or Edit Existing Dashboards
      • Server Cleanup
    • Configuration
      • Configuring HCM to Campaign and Country Needs
      • Service Configuration
        • Individual Registry
        • Household Registry
        • Product Registry
        • Facility Registry
        • Stock & Inventory
        • Project Services
        • Referral Management
        • Attendance
        • Complaints
          • QA Sign-Off
            • Test Cases
        • User Management
          • QA Sign-Off
        • Muster Roll
        • Expense Service
        • Expense calculator
      • UI Configuration
        • Stock Management
        • Language Selection
        • Login
        • Forgot Password
        • Project Selection
        • Dashboard Configuration
          • Dashboard UI Enhancements
          • HCM Dashboard Master Promotion Guide
        • Attendance Management
          • Attendance Package Extraction and Interaction with HCM Application
    • Quality Assurance Testing
      • Regression Test cases
        • HCM Product
        • HCM Console
        • Microplanning
      • Eligibility and CLF Test cases
      • Console v0.3.1
      • Micro planning v0.2
      • HCM Payments v0.1
  • 🔵COMMUNITY
    • Source Code
    • Committee
      • Digital Product Advisory Committee Charter
      • Idea Management Process
      • Sessions
        • November 2023 Session
        • August 2024 Session
          • Minutes of the Meeting
        • December 2024 Session
    • HCM Declarative Statements & FAQs
Powered by GitBook

All content on this page by eGov Foundation is licensed under a Creative Commons Attribution 4.0 International License.

On this page
  • Overview
  • Existing Capabilities
  • New Capabilities
  • User Roles
  • Steps to use the SMC Dashboard
  • Modules
  • Features

Was this helpful?

Export as PDF
  1. HCM PRODUCT SUITE
  2. Health Products
  3. Campaign Management Dashboard

SMC Dashboard

Overview

Supervisors can use the real-time dashboard to monitor campaign activities and track coverage, enabling them to make informed, data-driven decisions.

Existing Capabilities

  • Download charts in PDF or JPG format.

  • Share charts via WhatsApp or email.

  • A diverse range of charts and graphs for visualising key metrics.

  • Drill-down functionality for detailed data examination.

  • Multi-language support.

  • Geographic boundary-based heat maps.

  • Geo-coordinate map to view delivery data at the household level.

  • Restrict data access based on user hierarchy.

  • Tab navigation across modules.

  • Predictive charts to forecast campaign extensions.

  • Filter and sort tables.

  • View data for custom date ranges or specific campaign cycles.

New Capabilities

  • Side-by-side bar chart visualization for more than 2 variables

  • Venn diagram for inter-cycle analysis

  • Filter data by cycles

User Roles

The dashboard data will be customized based on the user's hierarchical level, ensuring access is aligned with their specific operational scope. For example, a national supervisor will have oversight of the entire campaign at the national level, while a provincial supervisor will have access to data within their assigned province, and a district supervisor will only have access to data within their assigned district, with no visibility into other districts.

Steps to use the SMC Dashboard

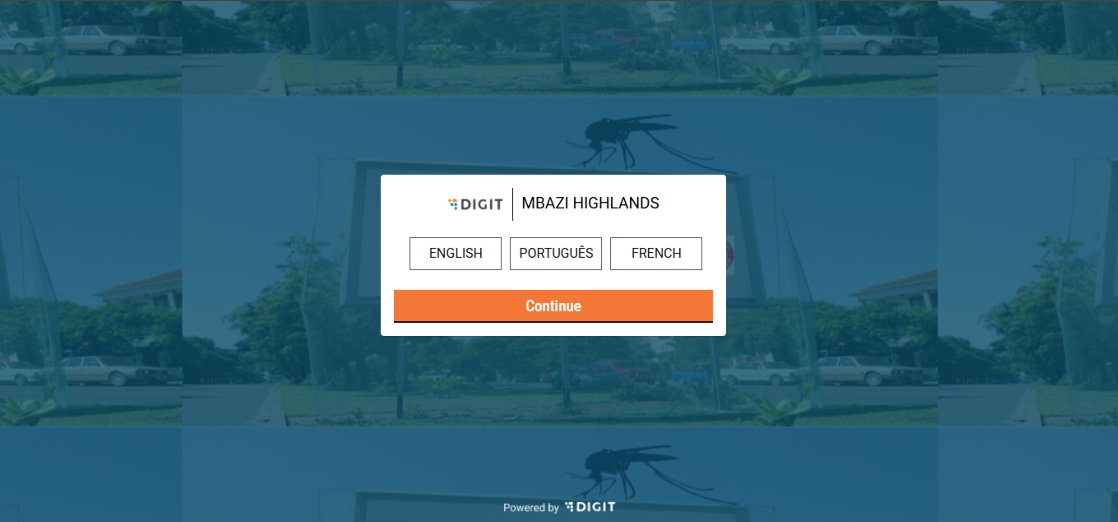
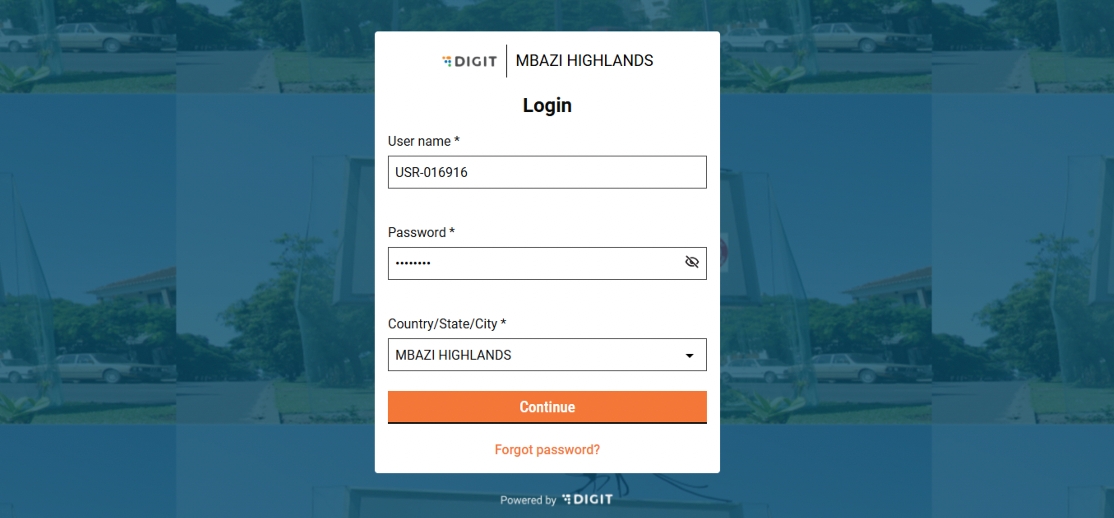
To access the dashboard, open your browser and enter the URL [ ]. The language selection screen will appear, select the preferred language and click on ‘Continue’. You will navigate to the ‘Login’ page. Log in with your credentials and click on ‘Continue’.

After logging in, you will land on a page listing all campaign dashboards.

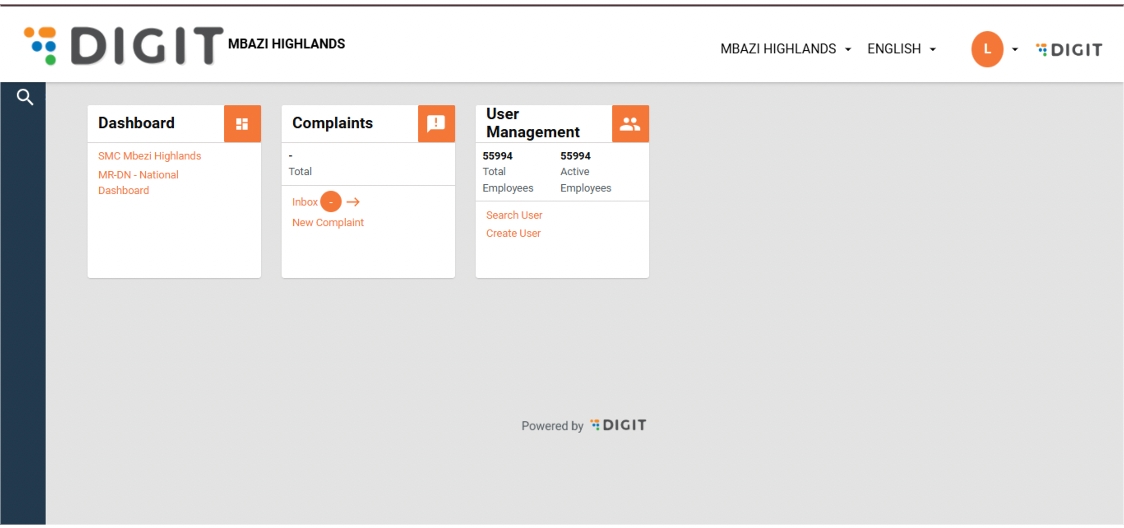
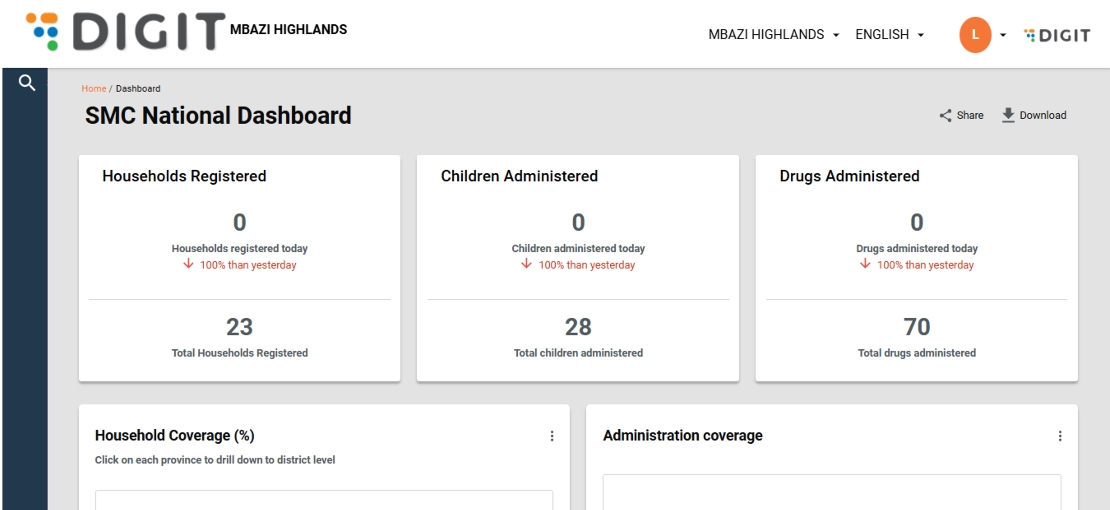
Click on the dashboard. If you are a National Supervisor, the landing page you will see is the national overview page.

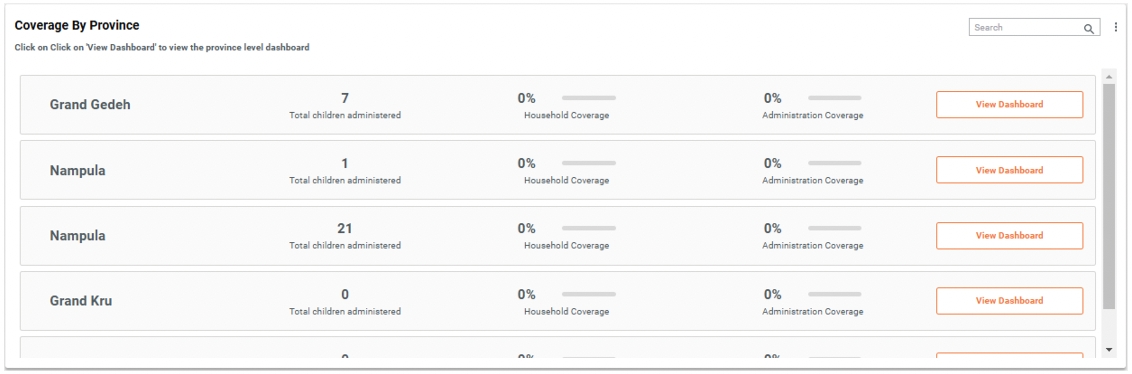
To navigate to a sub-national level dashboard, click on the ‘View Dashboard’ button next to the sub-national boundary name.

Modules

The dashboard is divided into several tabs based on campaign modules: Registration & Delivery, Inventory, Complaints, Supervision, Team Performance, Data Quality, and Referral and Side Effects.

Features

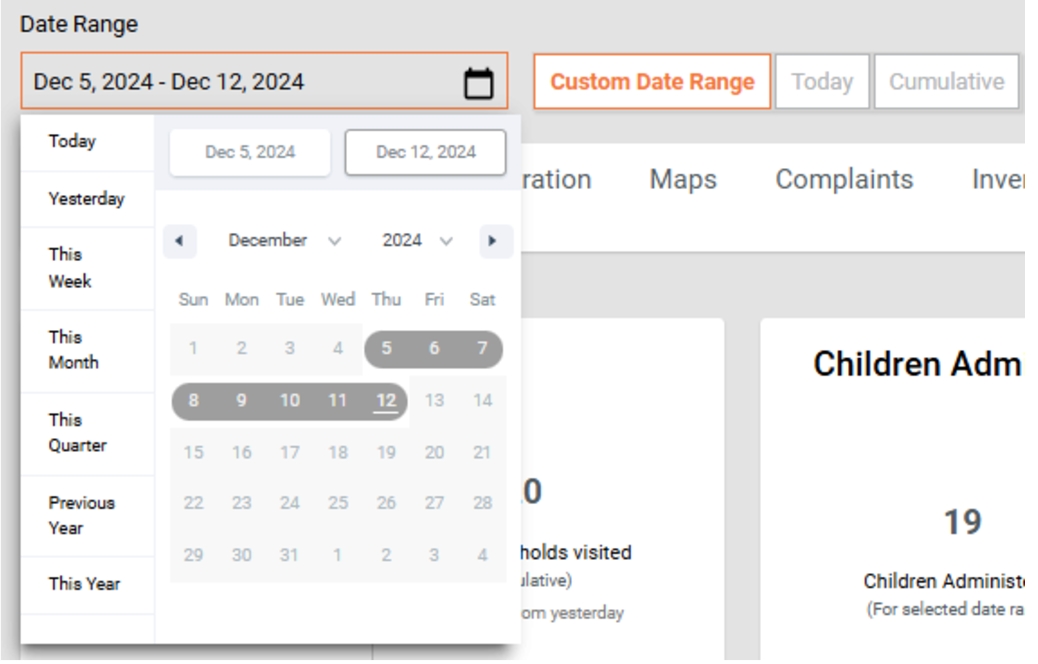
Date Filters: Each page has filters to view data for a specific date range, today's data, or cumulative data since the campaign's start.

Campaign Progress: A progression line at the top displays the number of days since the campaign began.

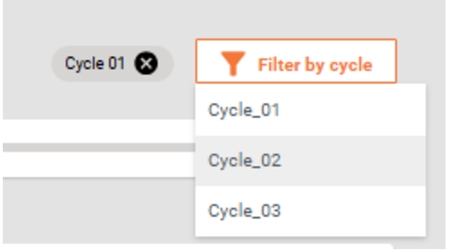
Filter by cycle: This allows you to view and analyze data for specific treatment cycles in the seasonal malaria chemoprevention campaign. Since children are treated in multiple cycles, this filter helps you focus on performance and coverage for a particular cycle, making it easier to track progress and identify gaps.

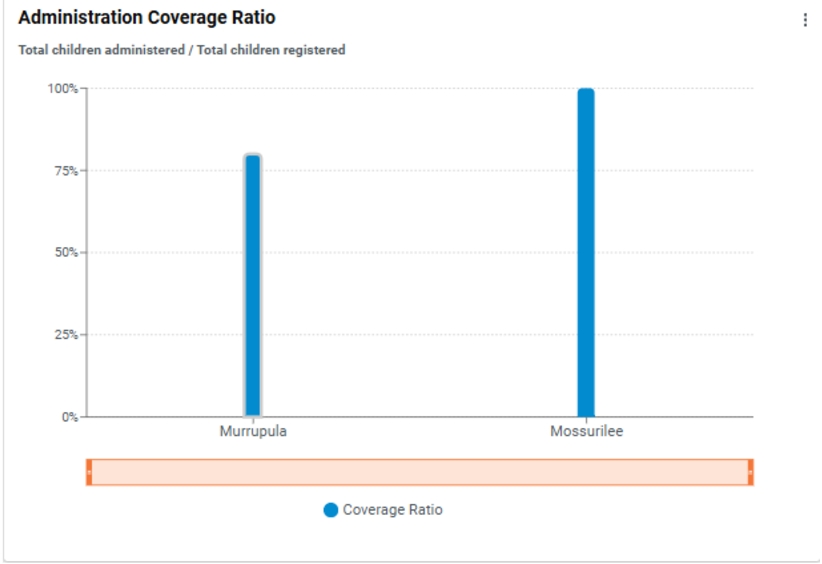
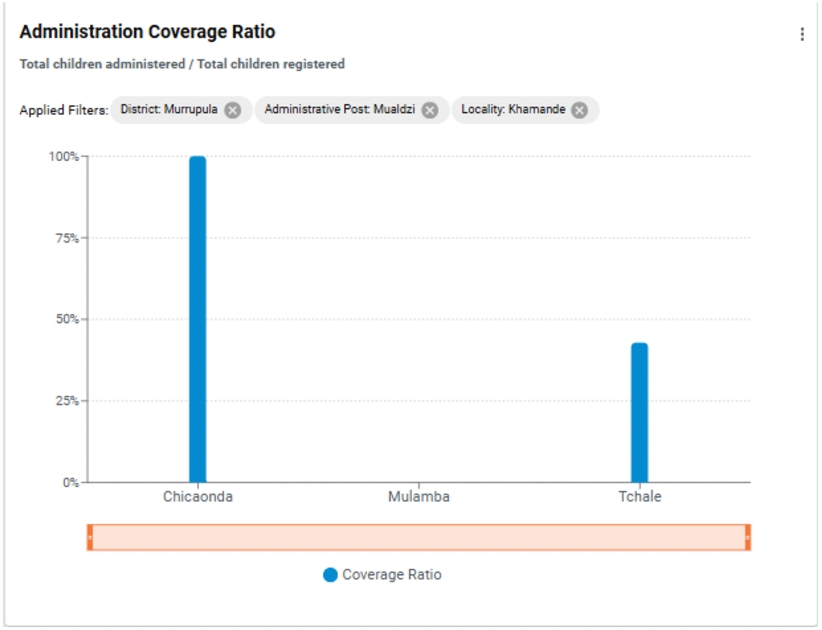
Drill-Down Bar Charts: Click on any bar to drill down to sub-boundaries, continuing until the lowest level (e.g., a village). To return to the previous view, click the 'x' button.

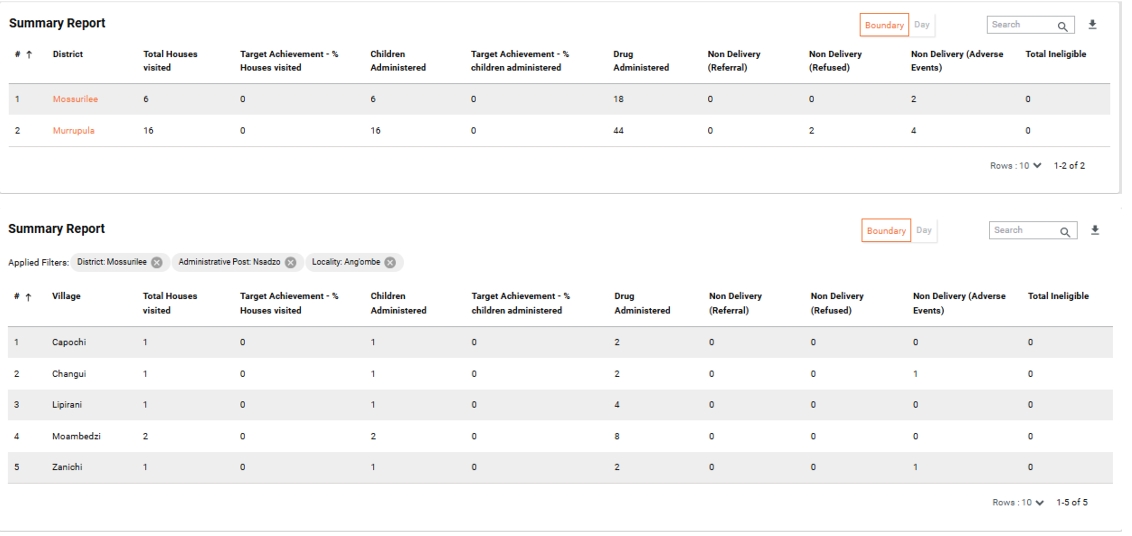
Drill-Down Table Charts: Click on any boundary in the table to drill down to sub-boundaries, continuing until the lowest level (e.g., a village). To return to the previous view, click the 'x' button.

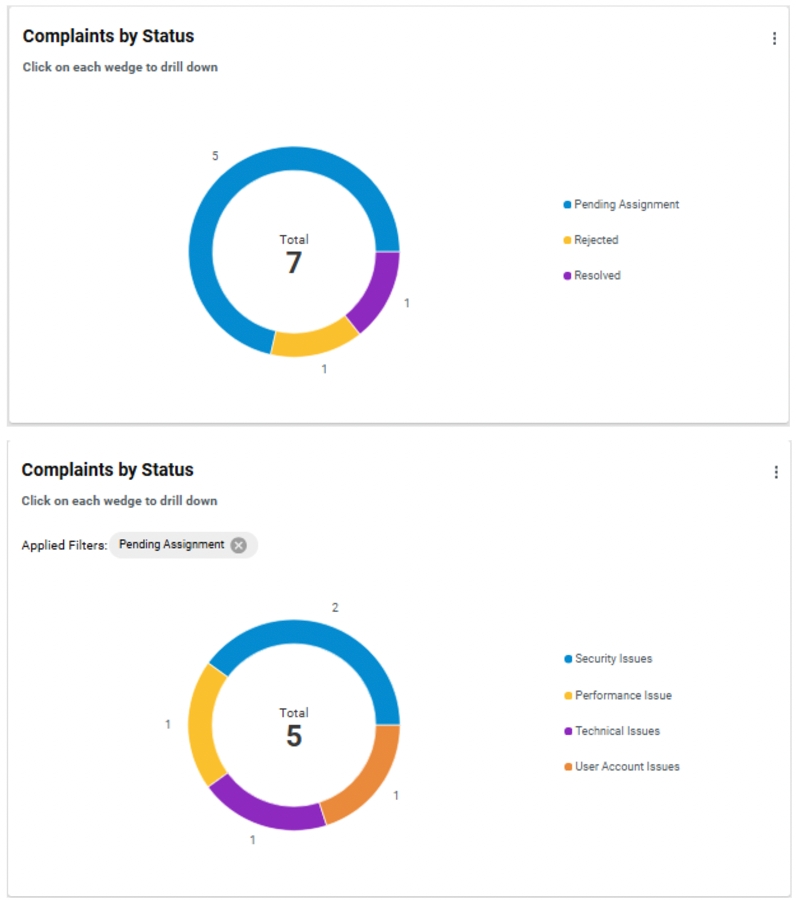
Drill-Down Pie Charts: Click on any slice in the pie chart to drill down to sub-categories or data split across sub-boundaries. To return to the previous view, click the 'x' button.

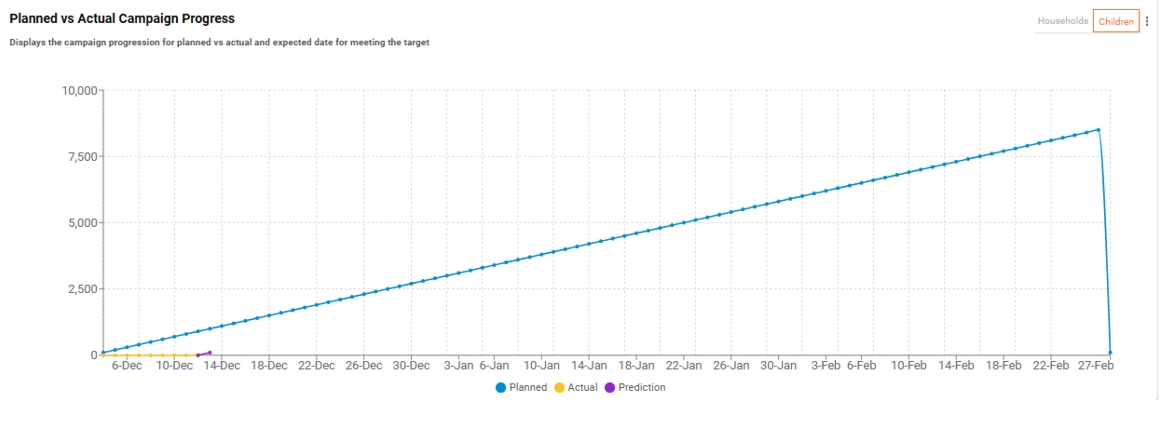
Prediction Line Chart: Estimates how many more days are needed to reach target coverage based on current service delivery rates.

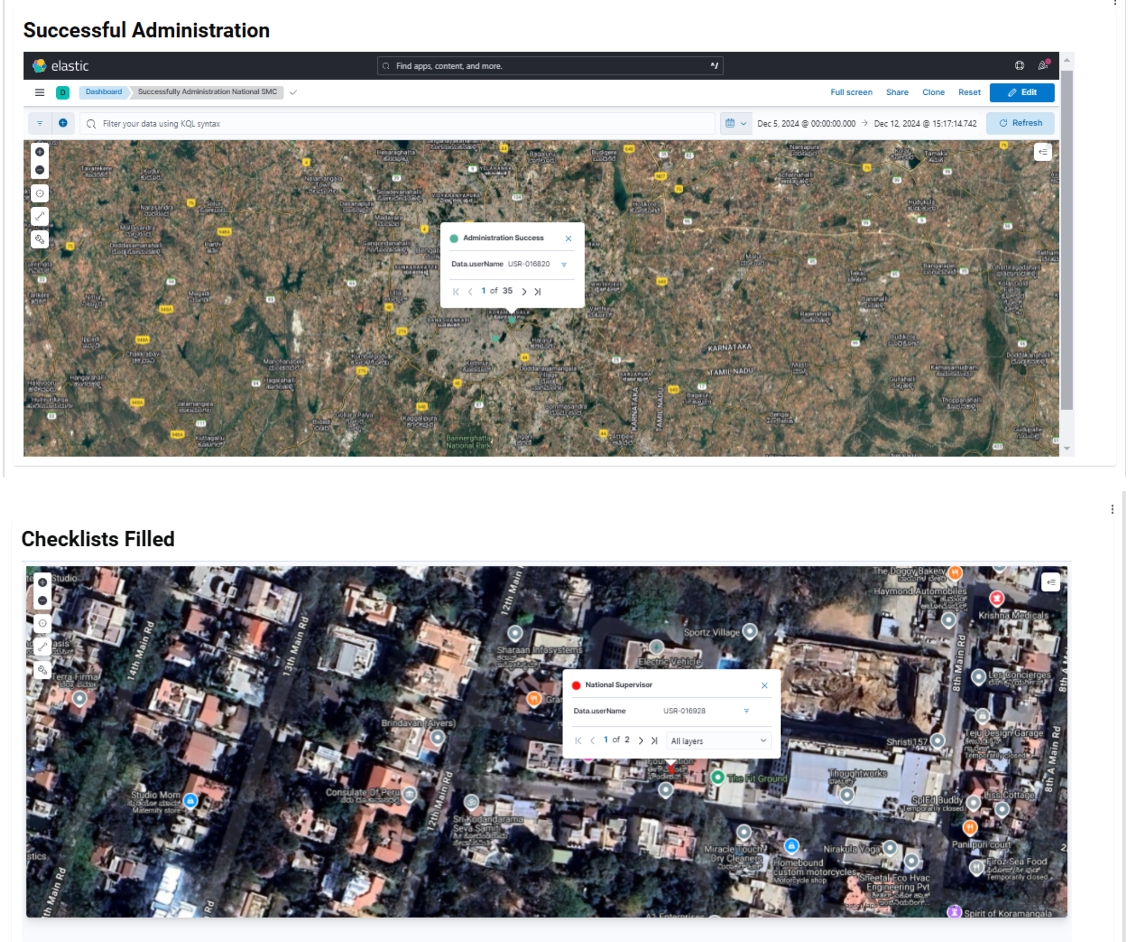
Geocoordinate maps: To monitor distributor coverage and track supervisor performance, the system uses the geographic coordinates of completed checklists. On a zoomed-out map, the coordinates are grouped into clusters for easier viewing. By clicking on a cluster, users can see details such as the total number of points in the cluster and information about the supervisors who recorded the data. This makes it easy to track performance and coverage across different areas.

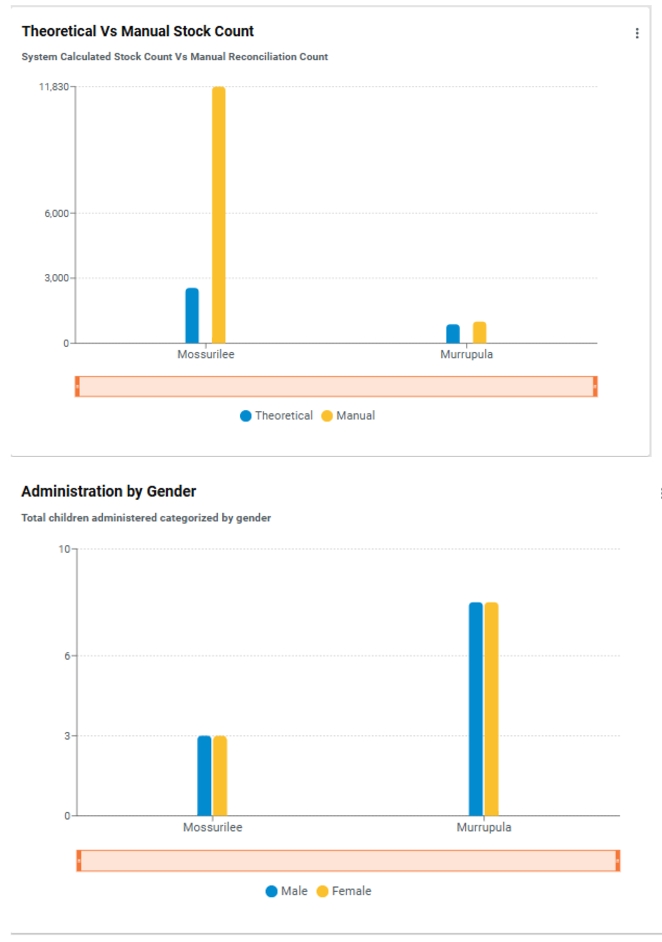
Side-by-side comparative bar charts (2 variables): The side-by-side bar charts enable a clear comparative analysis between two distinct variables, making it easier to identify differences and trends. For example, they can be used to compare coverage by gender concerning population distribution. Additionally, side-by-side bar charts can visualize the comparison between expected stock levels and actual stock balance. This provides a clear view of inventory management, helping supervisors determine whether stock levels are in line with the campaign’s needs, or if there are discrepancies that could lead to shortages or overstocking.

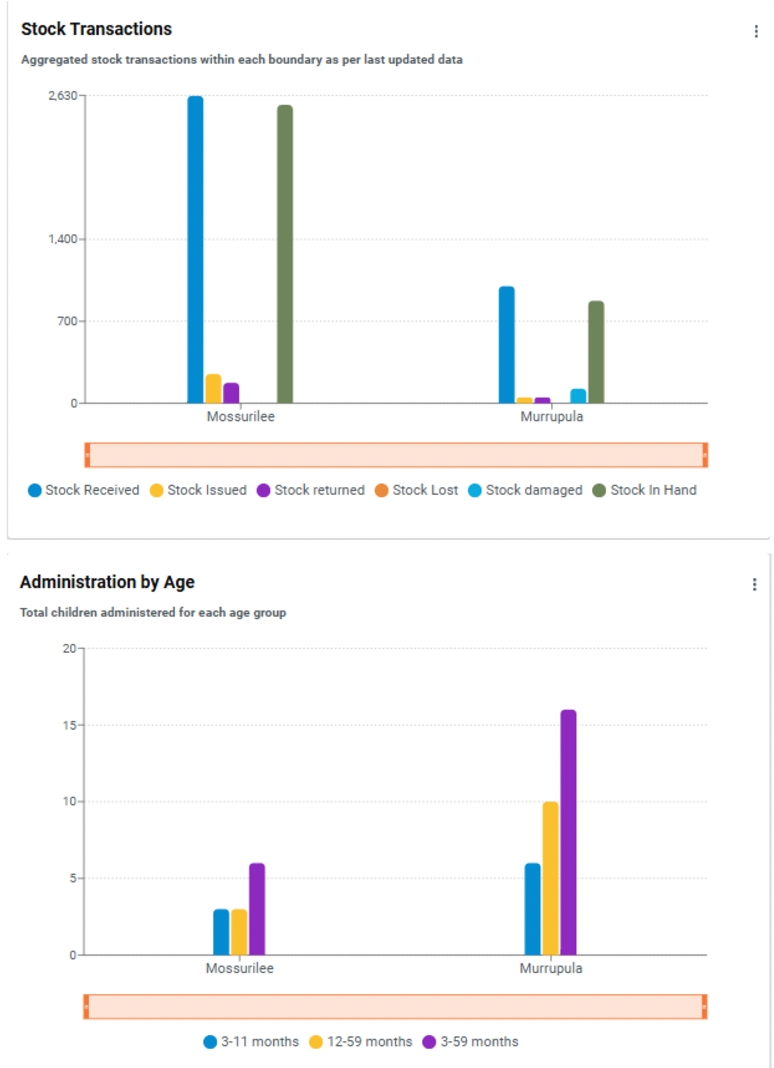
Side-by-side bar chart (More than 2 variables): This layout allows supervisors to view multiple relevant variables simultaneously in a single, unified chart. By displaying these indicators next to each other, supervisors can easily compare and analyze the data across different dimensions, such as age categories, referral summary, and stock movements. The ability to view all relevant variables at once enhances efficiency, allowing for quicker identification of trends, patterns, or areas requiring attention.

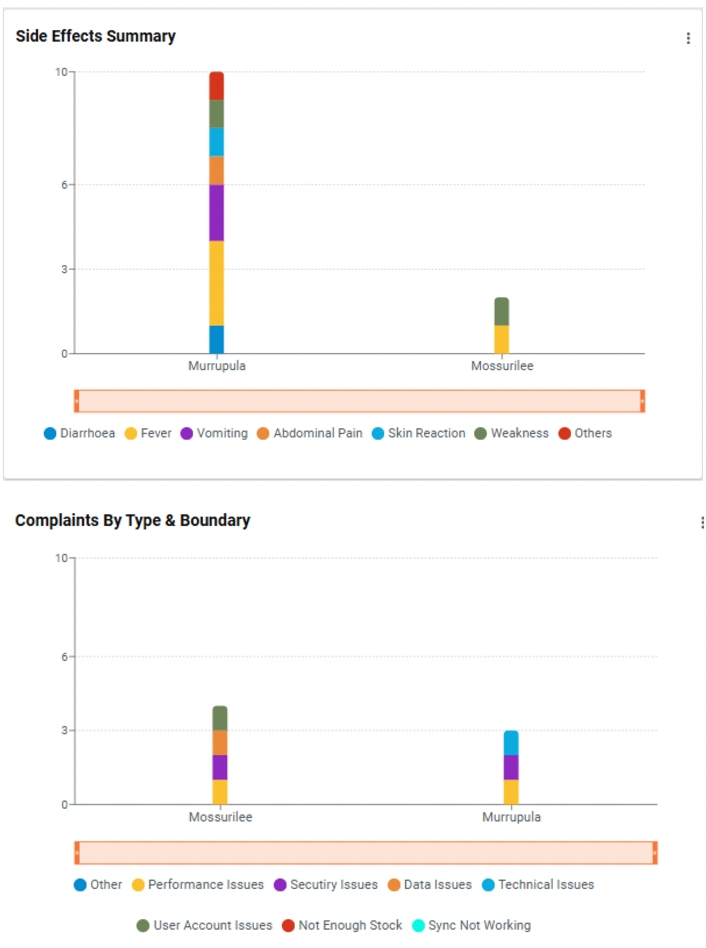
Stacked bar charts: Stacked bar charts are an effective tool for visualizing the distribution of data across multiple variables, allowing for easy comparison and analysis. For example, a stacked bar chart can display the number of complaints filed within each operational boundary (district), grouped by factors such as the type or status of the complaint (pending, resolved, rejected).

Similarly, the chart can be used to show the types of side effects recorded during the campaign, with the side effect categories stacked vertically for each boundary. This enables stakeholders to easily identify trends, compare performance across regions or cycles, and pinpoint areas that may require further attention or intervention. By clustering data in this way, the chart provides a clear, comparative view that helps drive data-driven decisions and enhance campaign efficiency.

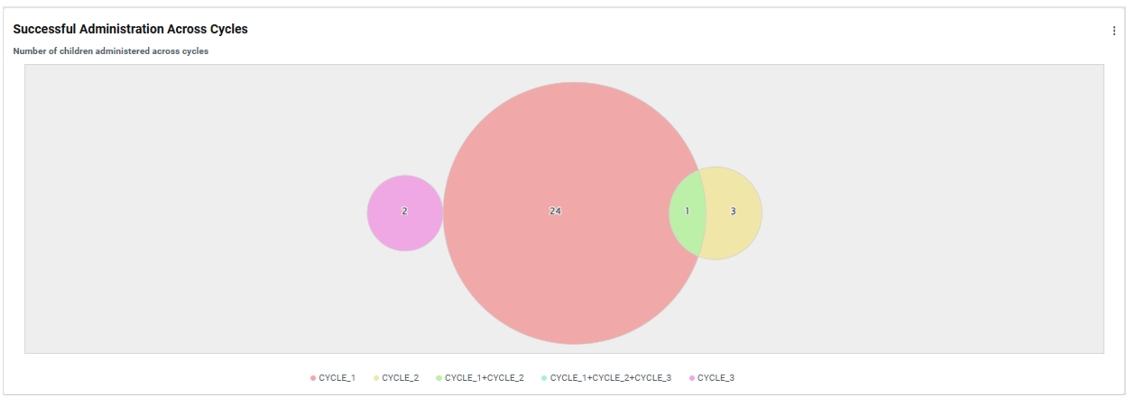
Venn diagram for inter-cycle analysis: The Venn diagram on the dashboard visually represents the overlap and distribution of inter-cycle children administration data. It illustrates the number of children who received treatment across different cycles, highlighting:

  • Cycle 1: Children treated in the first cycle.

  • Cycle 2: Children treated in the second cycle.

  • Overlap: Children who received treatment in both cycles.

This diagram helps identify the extent of coverage across different cycles and ensures that children who need multiple rounds of treatment are properly accounted for. It provides a clear visual of treatment gaps and overlaps, supporting efficient campaign management and decision-making

PreviousAuth Proxy Setup and Configuration for KibanaNextMicroplanning

Was this helpful?

🎯